Follow a swim beyond the pool: see the recorded route, read pace per 100 m, and compare changes in heart rate and stroke rate. Distance-based best efforts show where you sustained your fastest swimming within the session.
Real EffortSignal web screenshots using a demo swim from 22 August: 3.8 km in 1:04:36. Activity analysis is included in Free and Pro.
Start with the route and the session
The activity summary shows distance, duration, pace, heart rate and stroke rate when recorded. Track map places the GPS trace in context. Choose Speed or Heart rate to colour the track by a recorded metric.
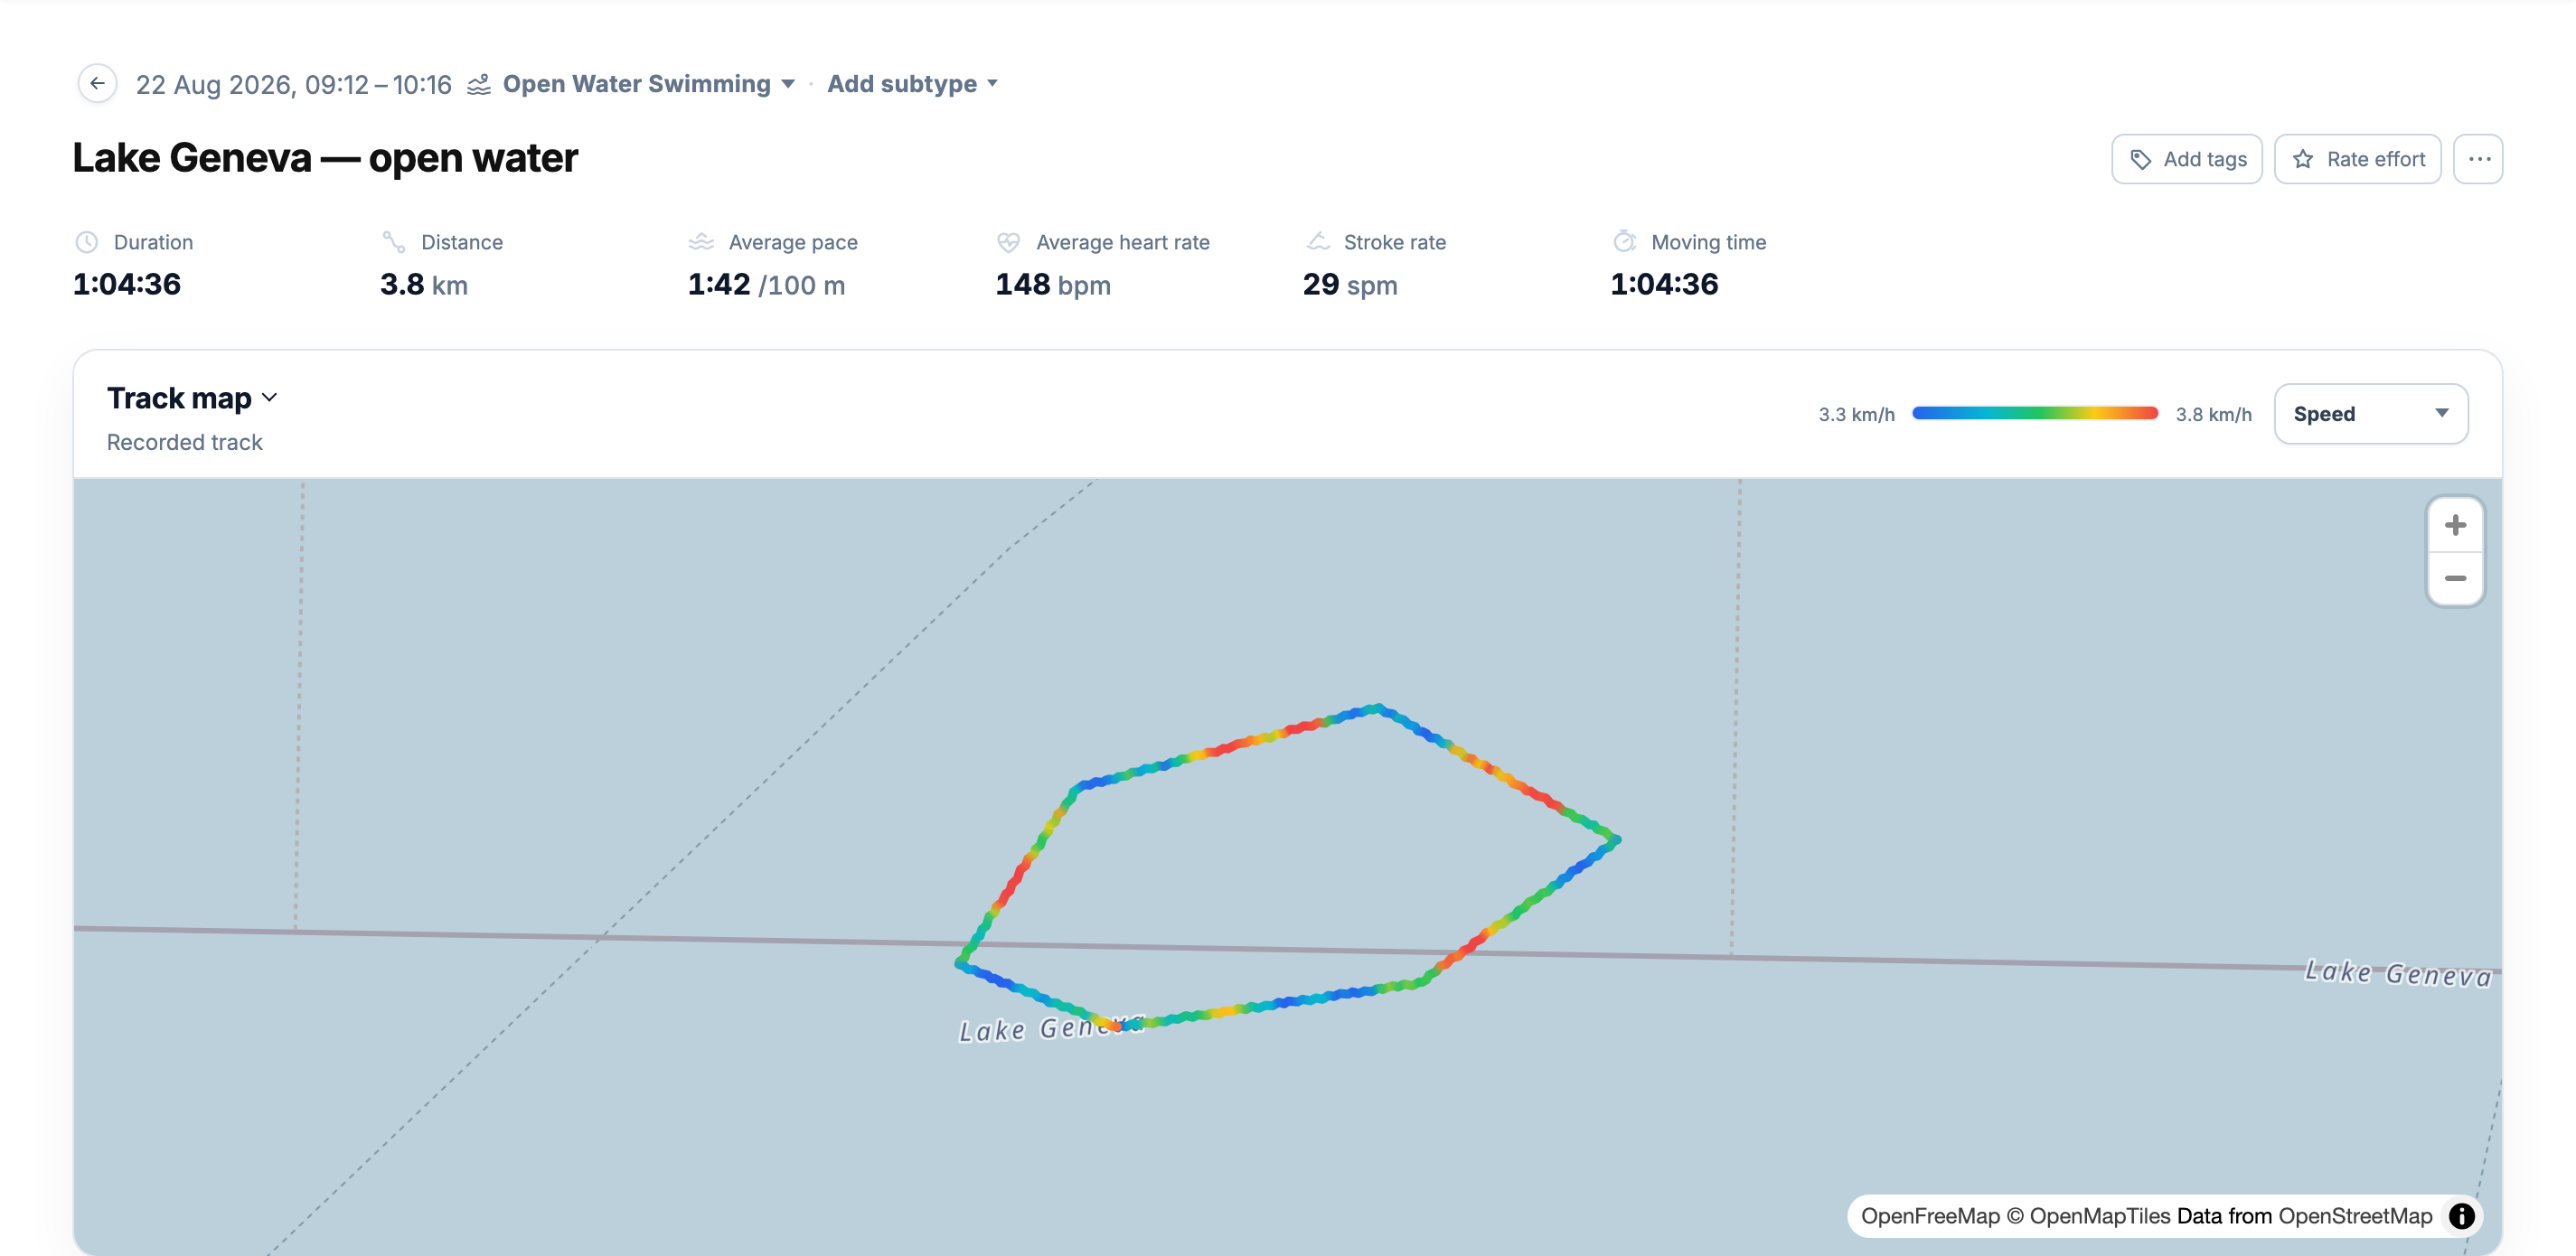
A route requires recorded positions. Pace and best efforts depend on the source distance and speed data, so GPS errors can affect the result. The map shows the recorded track; it does not correct for currents or calculate a current-adjusted swimming pace.
Read pace and stroke rate together
Overview keeps heart rate first, followed by pace per 100 m. Select Swimming for the pace and Stroke rate charts. Stroke rate uses recorded cadence, in spm, so it can be shown even when the activity has no pool-length messages.
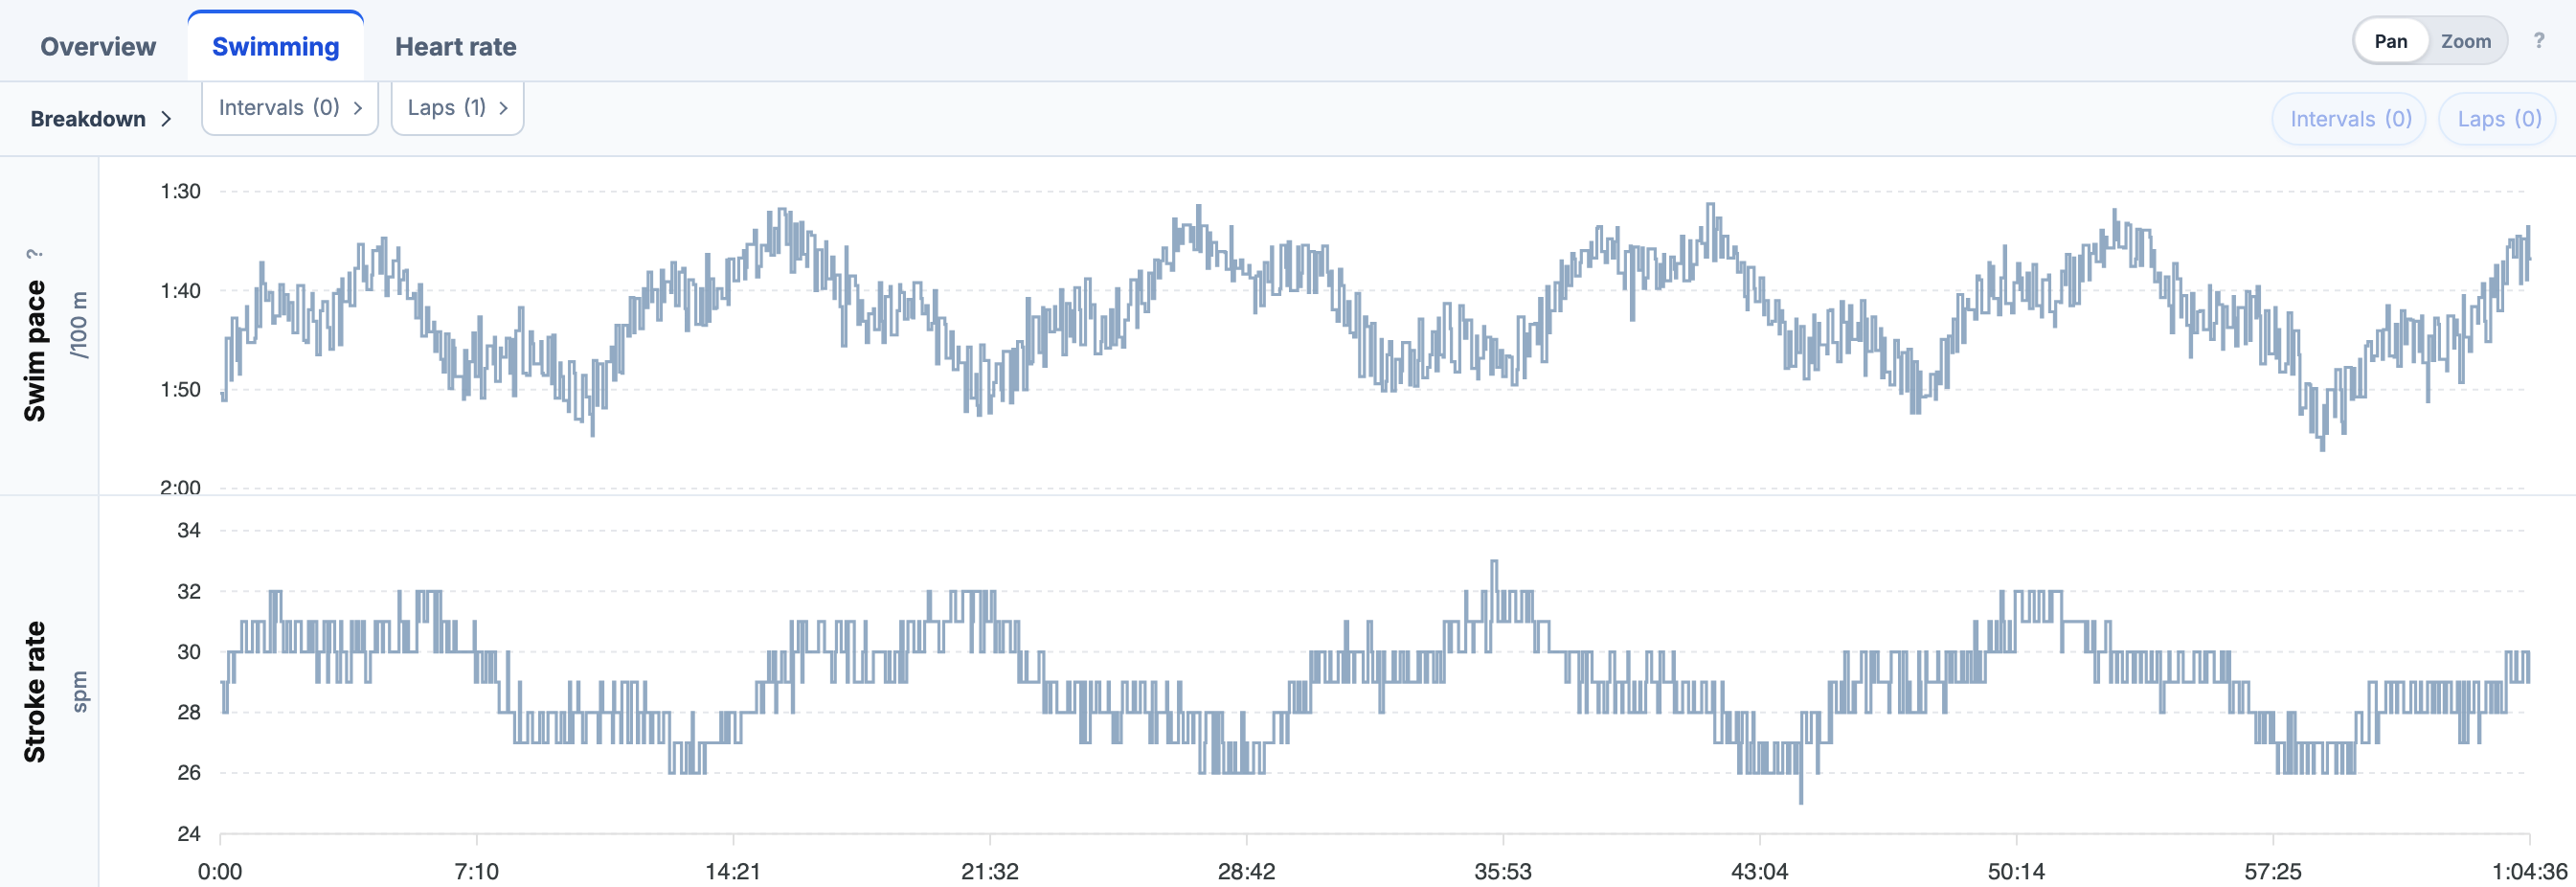
Use Heart rate for its available charts and duration curve. Recorded cadence provides stroke-rate analysis even when stroke style or total stroke count is unavailable. Length counts and SWOLF require pool-length recordings.
Best efforts without pool walls
The swim pace curve and table cover 50, 100, 200, 400, 800 and 1500 m within the activity. EffortSignal finds the fastest elapsed time over each distance using the recorded distance stream. Boundaries between nearby samples are interpolated; long gaps and distance resets are excluded.
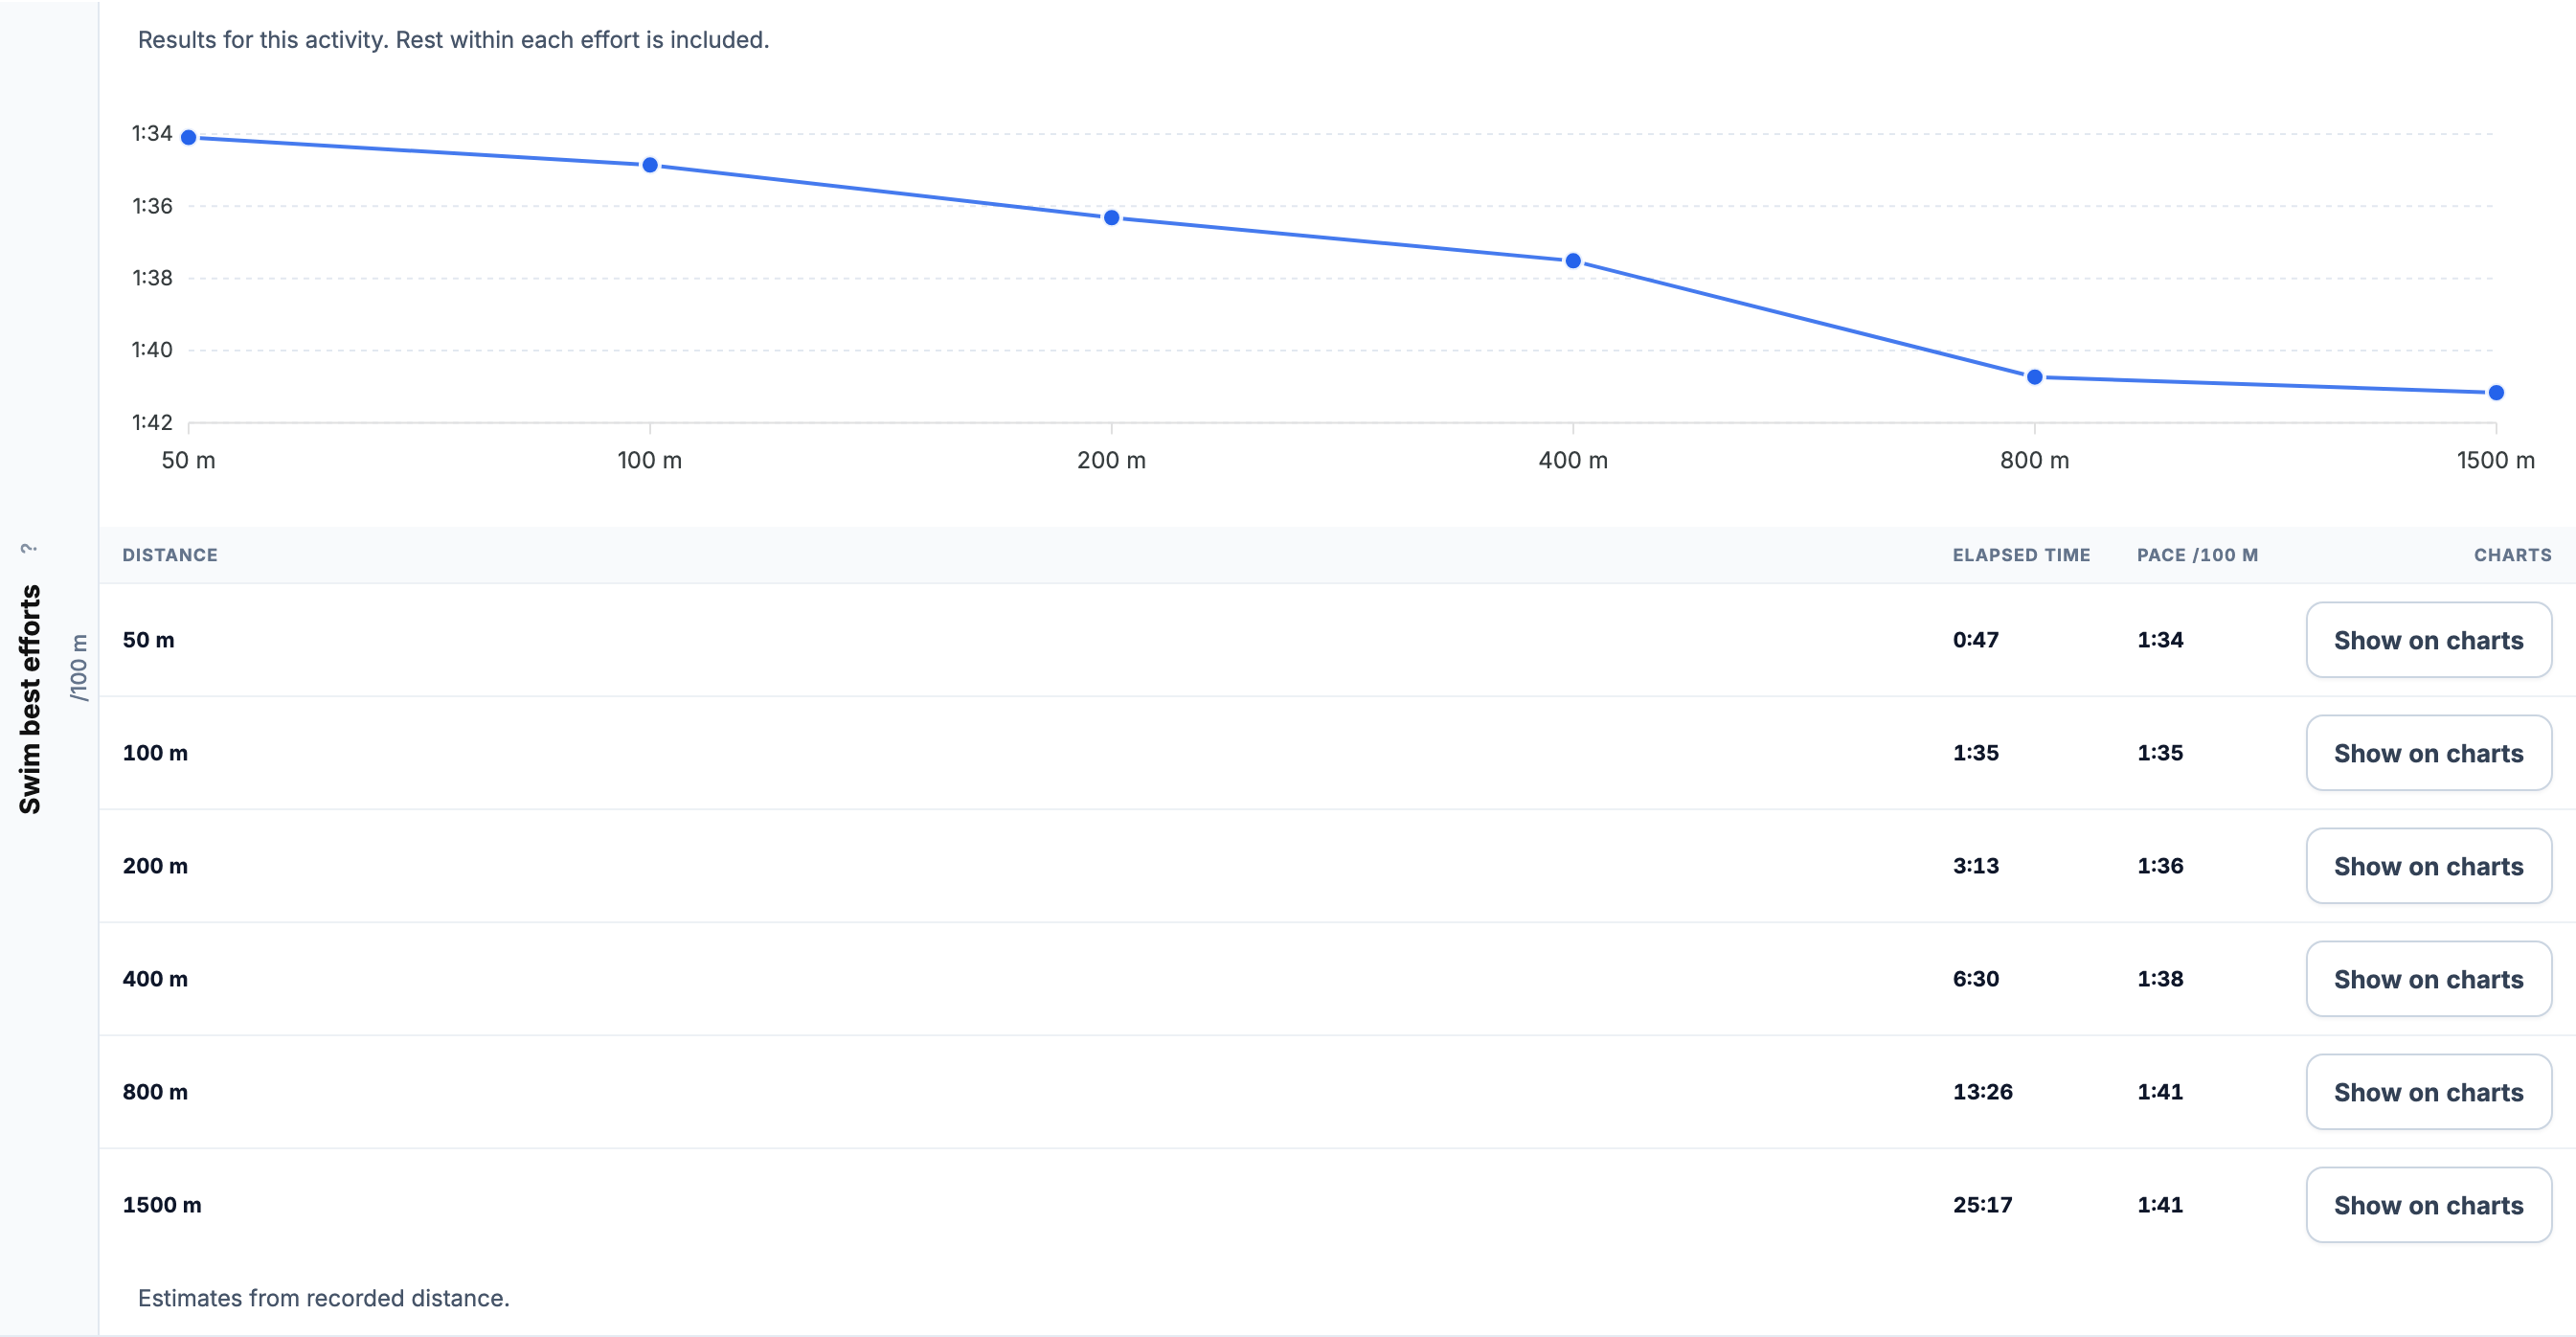
Rest inside the chosen effort remains included. Show on charts highlights the effort without changing the zoom. If the recording has insufficient continuous distance for a result, that distance stays unavailable.
Keep the laps your device recorded
Review imported laps in Breakdown → Laps. This swim has one lap covering the whole activity. Select a time range to inspect a particular part of the swim, or save it as an interval for closer analysis.
Count the swim alongside the ride and run
For triathletes, the open-water session belongs in the same training history as the other two sports. With at least 90% heart-rate coverage and applicable resting and maximum HR settings, swimming produces TRIMP and contributes to Fitness (CTL), Fatigue (ATL) and Form (TSB). Recorded duration also appears in Training Volume, where the Swimming filter separates it from the combined total.
See Swimming Analytics for the load and volume screenshots, or Pool Swimming for recorded lengths, stroke metrics and pool best efforts.
All Pro features are free through January 31, 2027. No credit card or automatic charges. After Early Access, keep using Free or choose Pro. See Free and Pro plans.