TSB describes the balance between longer-term and recent recorded load entering a day. EffortSignal calls it Form in Dashboard and TSB in Calendar. It uses yesterday's CTL minus yesterday's ATL, so a workout changes the next day's TSB. Read it alongside the sessions and your recovery notes when reviewing a training block or lighter week.
Screenshots use synthetic French and Swiss training examples in the web app. The worked week is 31 August–6 September 2026. Training load, fitness, fatigue and form are included in Free and Pro.
Find Form in Dashboard
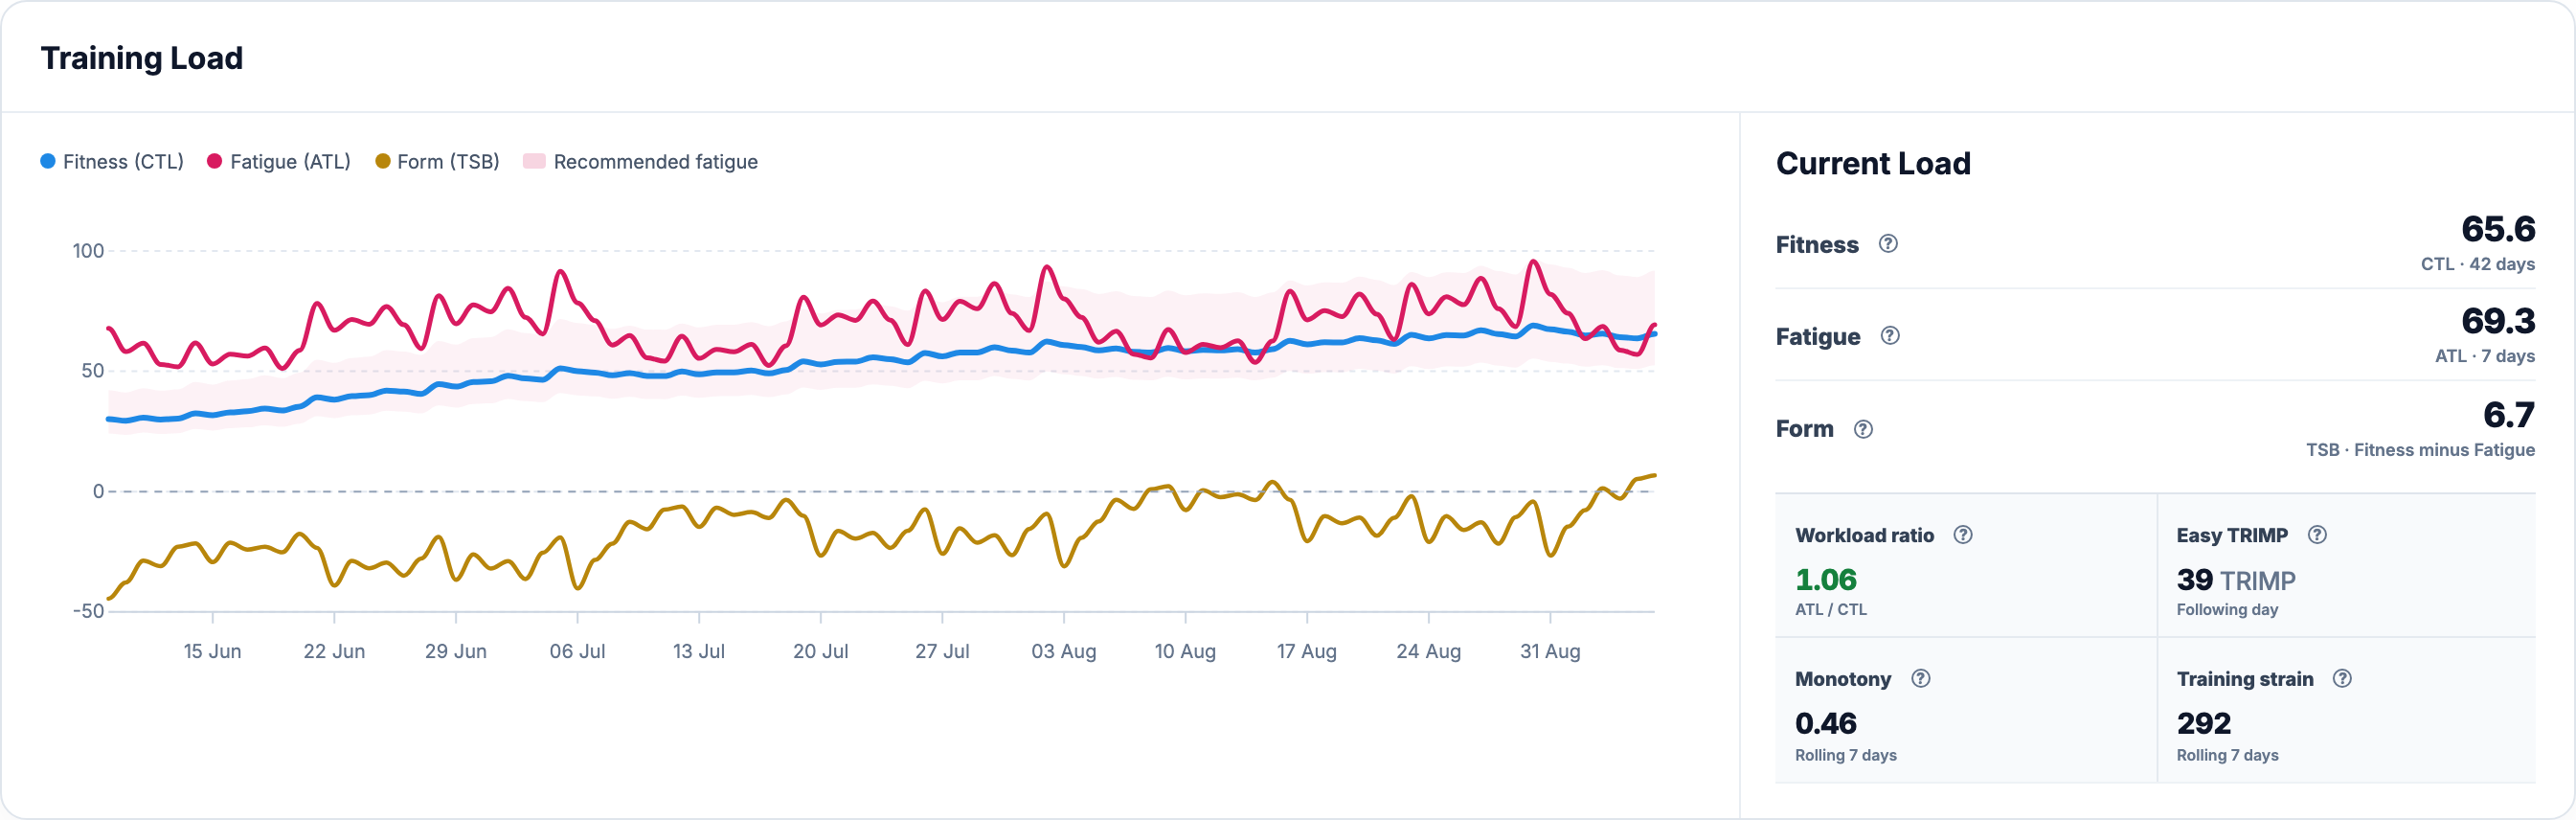
Open Dashboard → Training analytics → Training Load. Form (TSB) is the ochre line; Fitness (CTL) is blue and Fatigue (ATL) is pink. The Current Load panel shows all three values. On a phone, the panel follows the graph.
The date control beside Dashboard’s title selects a historical endpoint. Today returns to the present. Choose 42D, 3M, 6M, 1Y or 2Y to change the visible history. Hover or touch a measured line to inspect the values for that date. This lets you relate a fall in Form to the days of accumulated load around it.
The calculation uses the preceding day
EffortSignal builds its load history from daily TRIMP, the available cardiovascular load of recorded activities. ATL reacts faster to recent work; CTL changes more gradually. The recurrence uses coefficients of exactly 1/7 and 1/42:
ATL[d] = ATL[d−1] + (TRIMP[d] − ATL[d−1]) / 7
CTL[d] = CTL[d−1] + (TRIMP[d] − CTL[d−1]) / 42
TSB[d] = CTL[d−1] − ATL[d−1]
TSB is a difference on the same daily TRIMP-load scale as CTL and ATL. It is not a percentage or a score out of 100. A value below zero means recent modelled load exceeded longer-term load entering that day. Above zero means recent load was lower. These are estimates derived from recorded work, not measurements of how fresh or tired you feel.
The previous-day convention makes Form describe the balance before that day’s training. The TrainingPeaks explanation uses the same timing for its Form metric, though its TSS-based input differs from EffortSignal’s TRIMP history. Do not expect the two platforms’ numbers to match. TrainingPeaks: Performance Management Chart
Why +6.7 and a ratio above one can appear together
The demo’s dates make the distinction visible:
| Date | Updated CTL | Updated ATL | TSB entering this date | Workload ratio |
|---|---|---|---|---|
| 5 September | 63.7094 | 56.9865 | +5.3072 | 0.8945 |
| 6 September | 65.6035 | 69.3120 | +6.7229 | 1.0565 |
| 7 September | 64.2285 | 60.5321 | −3.7085 | 0.9424 |
On 6 September, 63.7094 − 56.9865 = +6.7229, shown as 6.7 in Dashboard. Sunday’s recorded endurance ride then raises ATL more than CTL. The resulting difference, 65.6035 − 69.3120 = −3.7085, is TSB for 7 September. The ratio uses the updated values immediately, so it is already 1.06 on Sunday.
This also explains why editing today’s completed activity normally changes today’s ATL and CTL but tomorrow’s Form. Changes to older activity inputs can propagate through all later dates. Calculations retain unrounded values; displayed one-decimal labels can differ slightly from a hand calculation.
Use the explanation beside Form
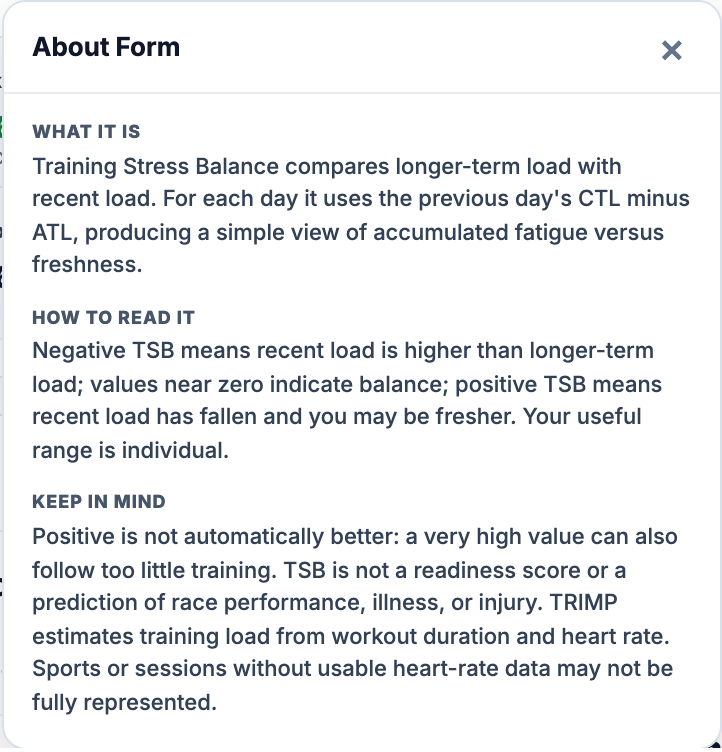
Click the circled ? beside Form for its meaning, date rule and interpretation limits. It opens a panel that can be closed with × or Escape. The app does not define a universal TSB target range in this panel.
Read TSB beside the week's sessions
Open Calendar and browse to 31 August–6 September. The desktop row keeps the dated activities beside a compact week summary. When load history is available, the summary includes CTL and TSB, plus completed duration. On a phone, use week navigation to reach the same dates.

Select the summary’s evidence area to open Week Details. For a current week, check the available through date: it describes the recorded state so far. Future planned workouts and estimated event load do not become completed CTL, ATL or TSB merely because they appear on the calendar. Use Workout Planner and Week Planner to construct the schedule; review the load history after activities are recorded.
Separate the endpoint from the change over the week
The Training load section starts with Training time, ATL, CTL, TSB and Workload ratio. Its small graph shows ATL and CTL by day. TSB is shown in a card here; the longer TSB line lives in Dashboard.
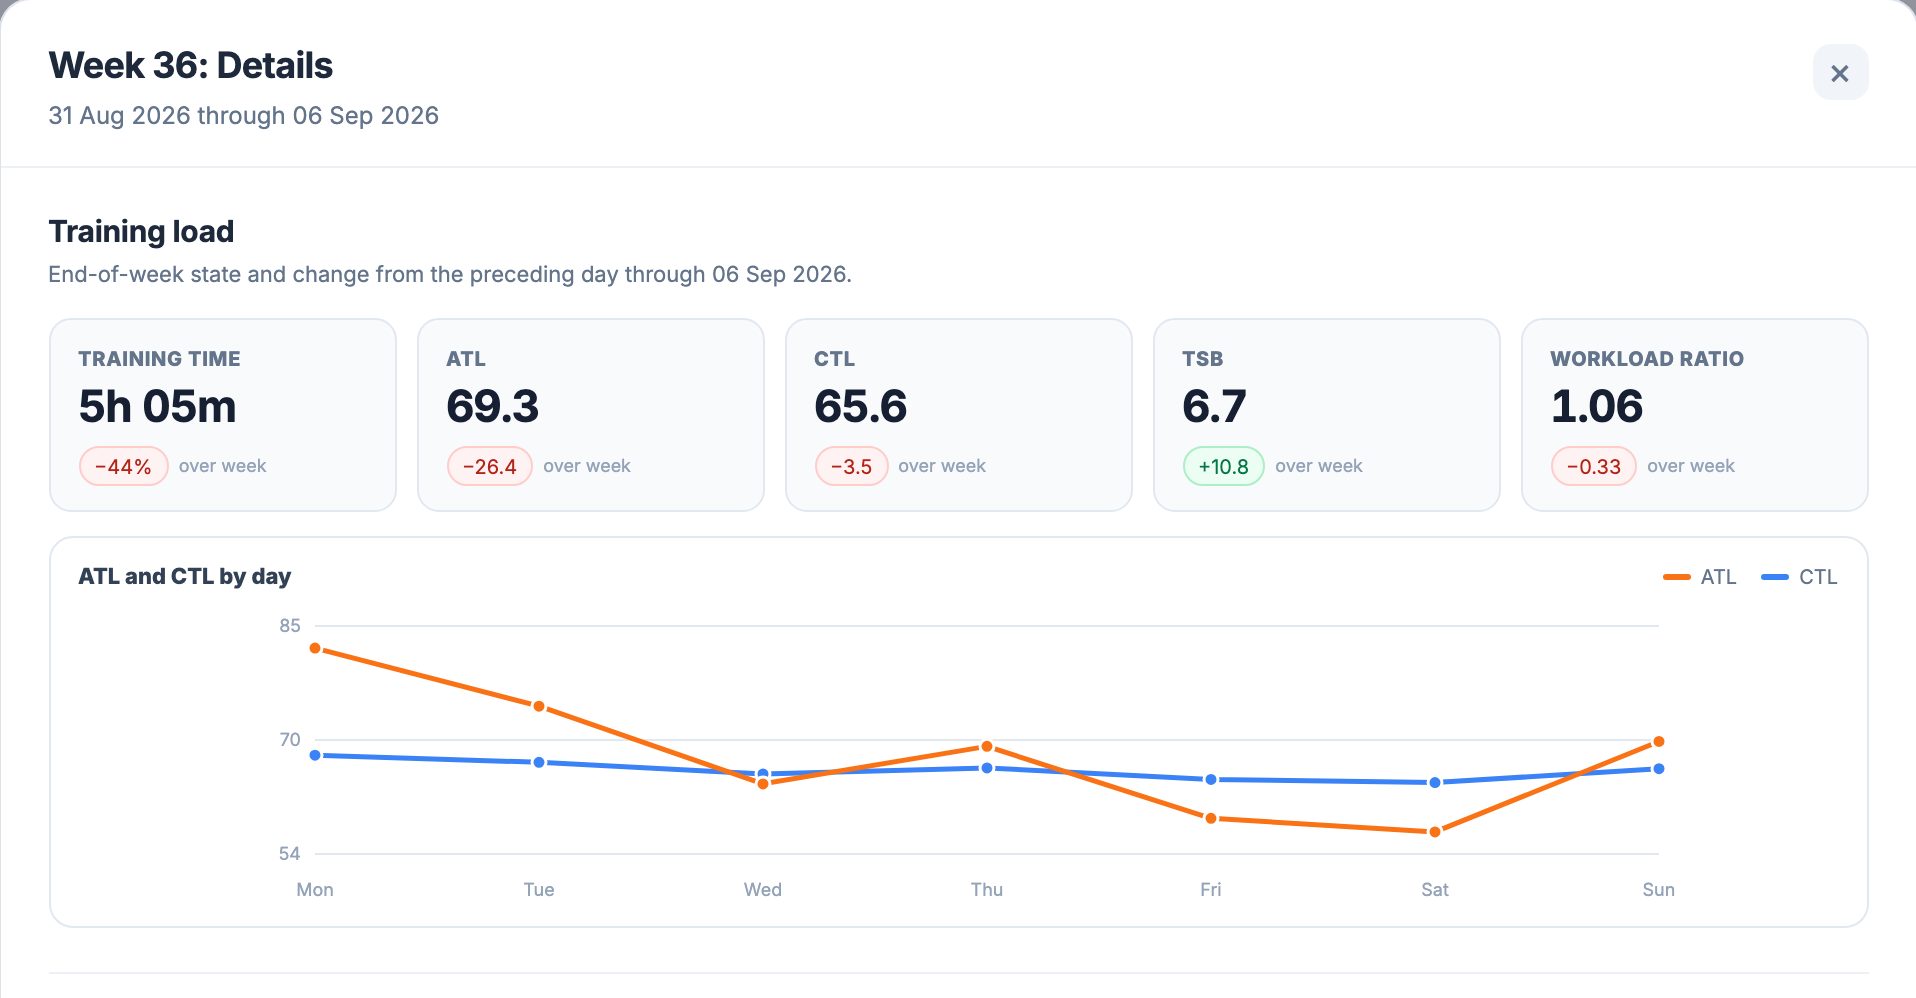
Over this week, ATL falls 26.4, CTL falls 3.5 and TSB rises 10.8. The faster ATL response explains why the balance can recover while CTL changes less. The CTL decrease is this completed week’s Ramp Rate. Inspect the daily graph and Calendar cards to locate the rest days and sessions instead of reading only the final difference.
Green and red change badges indicate numerical direction. A green TSB increase can accompany a deliberate reduction in training, but the colour does not establish recovery. No prior-day baseline means the preceding day’s value is missing; it is not a zero change. Load changes use the day before the selected week as their baseline, while the training-time percentage compares weekly durations.
How to use TSB when reviewing training
During a sustained training block, ATL can remain above CTL and TSB can remain negative. Use that pattern to describe accumulated recorded load, then inspect the workouts and how they went. A negative number alone does not establish that a session was inappropriate or that adaptation occurred.
During a lighter week or taper, ATL usually falls faster because its time constant is shorter. TSB moves upward. The demo shows this arithmetic, but it cannot supply a personal race-day target. Compare previous tapers with your actual performance, check-ins and Progress rather than treating one positive value as clearance for a hard workout.
After an extended break, the model can show positive TSB while CTL is falling. Maximising TSB would therefore be a poor training objective: it could reward simply doing less. The useful question is whether the pattern matches the intended block and the athlete’s response.
The underlying fitness–fatigue idea comes from impulse-response approaches to modelling training and performance. Those models require assumptions; this chart does not directly measure physiological fatigue or predict a race result. Morton, Fitz-Clarke and Banister, 1990
TSB and Workload ratio answer different questions
TSB expresses an absolute difference entering the day. ACWR / Workload ratio expresses a proportion after the selected day’s load. With CTL 50 and ATL 60, the ratio is 1.20 and the next day’s TSB is −10. With CTL 10 and ATL 12, the ratio is still 1.20 but the next day’s TSB is −2.
Dashboard also shows Easy TRIMP. It is a modelled following-day load ceiling derived from these same averages, not a measure of workout intensity. Its value solves for a subsequent TSB of zero, subject to a floor of zero:
Easy TRIMP = max(0, (41 × CTL − 36 × ATL) / 5)For the 6 September endpoint, it is about 39 TRIMP. This does not prescribe a 39-TRIMP session; sleep, symptoms, planned sport and the purpose of the week still matter. Readiness includes other evidence and has its own workload method.
What can make the history misleading
The full calculation starts at the first recorded activity with ATL and CTL set to zero. The first day’s TSB is therefore zero by construction. The first 41 days carry low-confidence context while history builds. Imported past activities can change the subsequent curves.
Rest days use zero TRIMP. Activities without usable HR can leave the daily contribution incomplete; workouts that were never imported can look like days off. PSS does not fill those gaps. Check the underlying recordings before interpreting a sharp rise in Form as a physiological recovery signal.
Daily boundaries follow the account timezone and the activity’s local start date, including recordings that cross midnight. Corrected inputs and timezone changes can change later values. The training-load methodology documents initialization, missing data and recalculation.
Methodology and sources
The calculations and UI were checked against current EffortSignal code on September 14, 2026. The two adjacent demo weeks use the normal persisted daily-load calculation. Product-specific coefficients, date boundaries and missing-data rules are documented above; the references provide the modelling background and terminology.
All Pro features are free through January 31, 2027. No credit card or automatic charges. After Early Access, keep using Free or choose Pro. See Free and Pro plans.