Efficiency Factor relates recorded output to heart rate. In cycling, EffortSignal divides Weighted Power by average HR and displays the result in W/bpm. Open the Power tab to see EF with its power metrics, or add Power / HR to the activity table to compare recordings.
Screenshots use synthetic French and Swiss training recordings in the web app. The power-weighting diagram is an illustration. Efficiency Factor is included in Free and Pro.
Find EF in the Power metrics
Open an activity and select Power. In Training Metrics → Power, the Efficiency Factor row sits with Weighted Power, Power Variability, intensity and work. EF is shown to two decimal places. The nearby ? opens an explanation on hover or keyboard focus; Escape dismisses it.
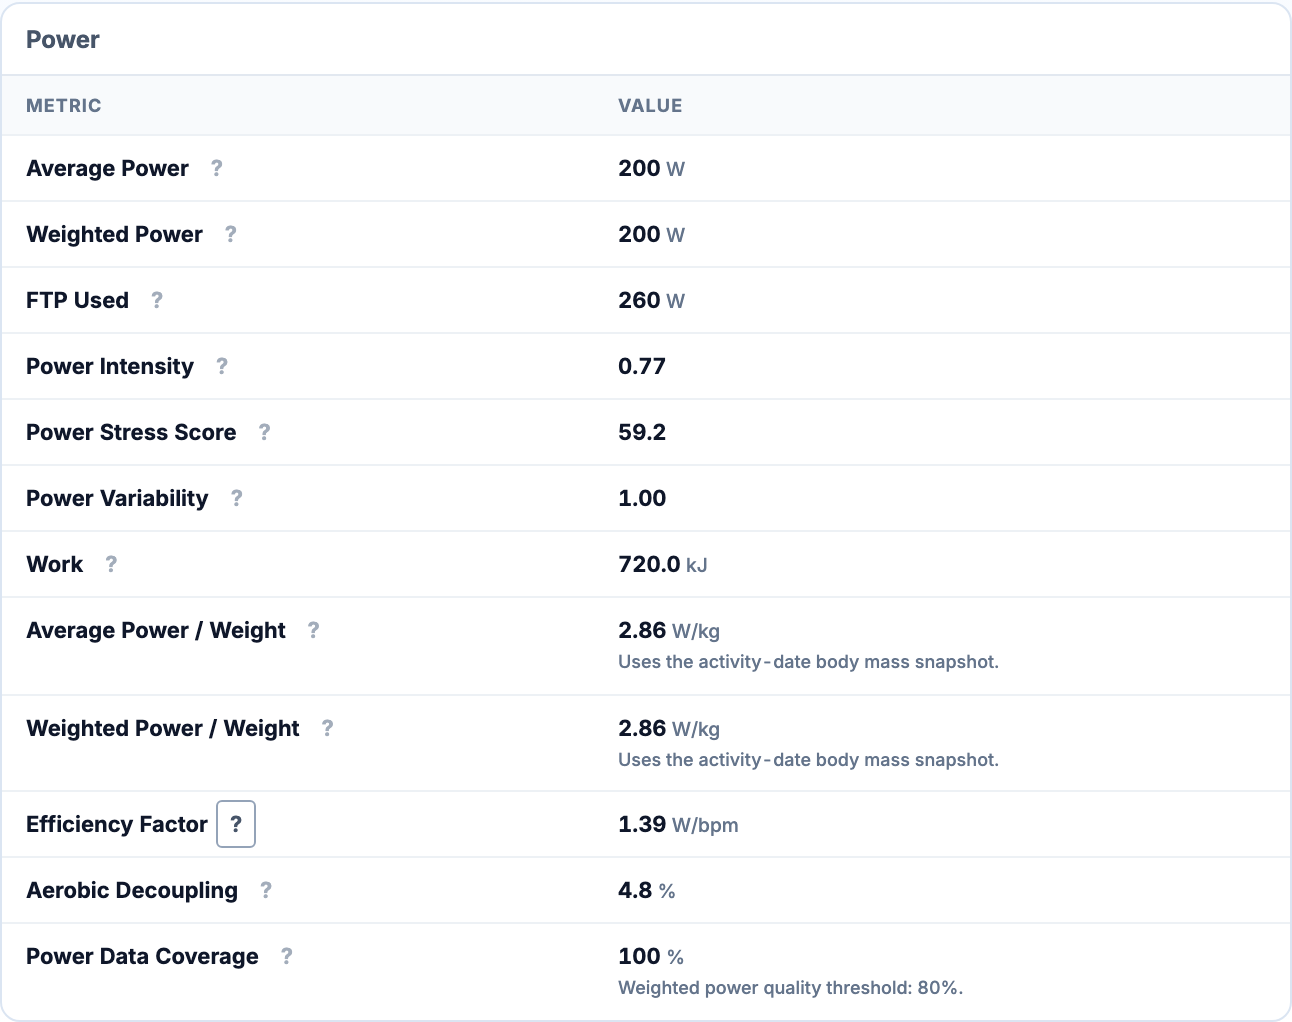
The app calls its fourth-power-weighted output metric Weighted Power. The familiar definition Normalized Power / average HR uses the same kind of ratio. EffortSignal documents its own sampling and missing-data rules rather than promising that every platform will return identical numbers. TrainingPeaks’ EF definition is useful background for that terminology.
What goes into the calculation
Cycling EF = Weighted Power (W) / average HR (bpm)For a steady 200 W effort at 150 bpm, EF is 1.333333 W/bpm, displayed as 1.33. At the same 200 W and 140 bpm, it is 1.428571, displayed as 1.43. The calculation uses the underlying unrounded metrics, so dividing the rounded numbers shown in different parts of the interface may not reproduce every final digit.
W/bpm describes the units of this ratio. It is not a percentage, watts per kilogram, mechanical work per heartbeat or an estimate of oxygen uptake. FTP and body mass are not inputs: changing your saved FTP alone does not change EF. Power Intensity and Estimated FTP answer different questions.
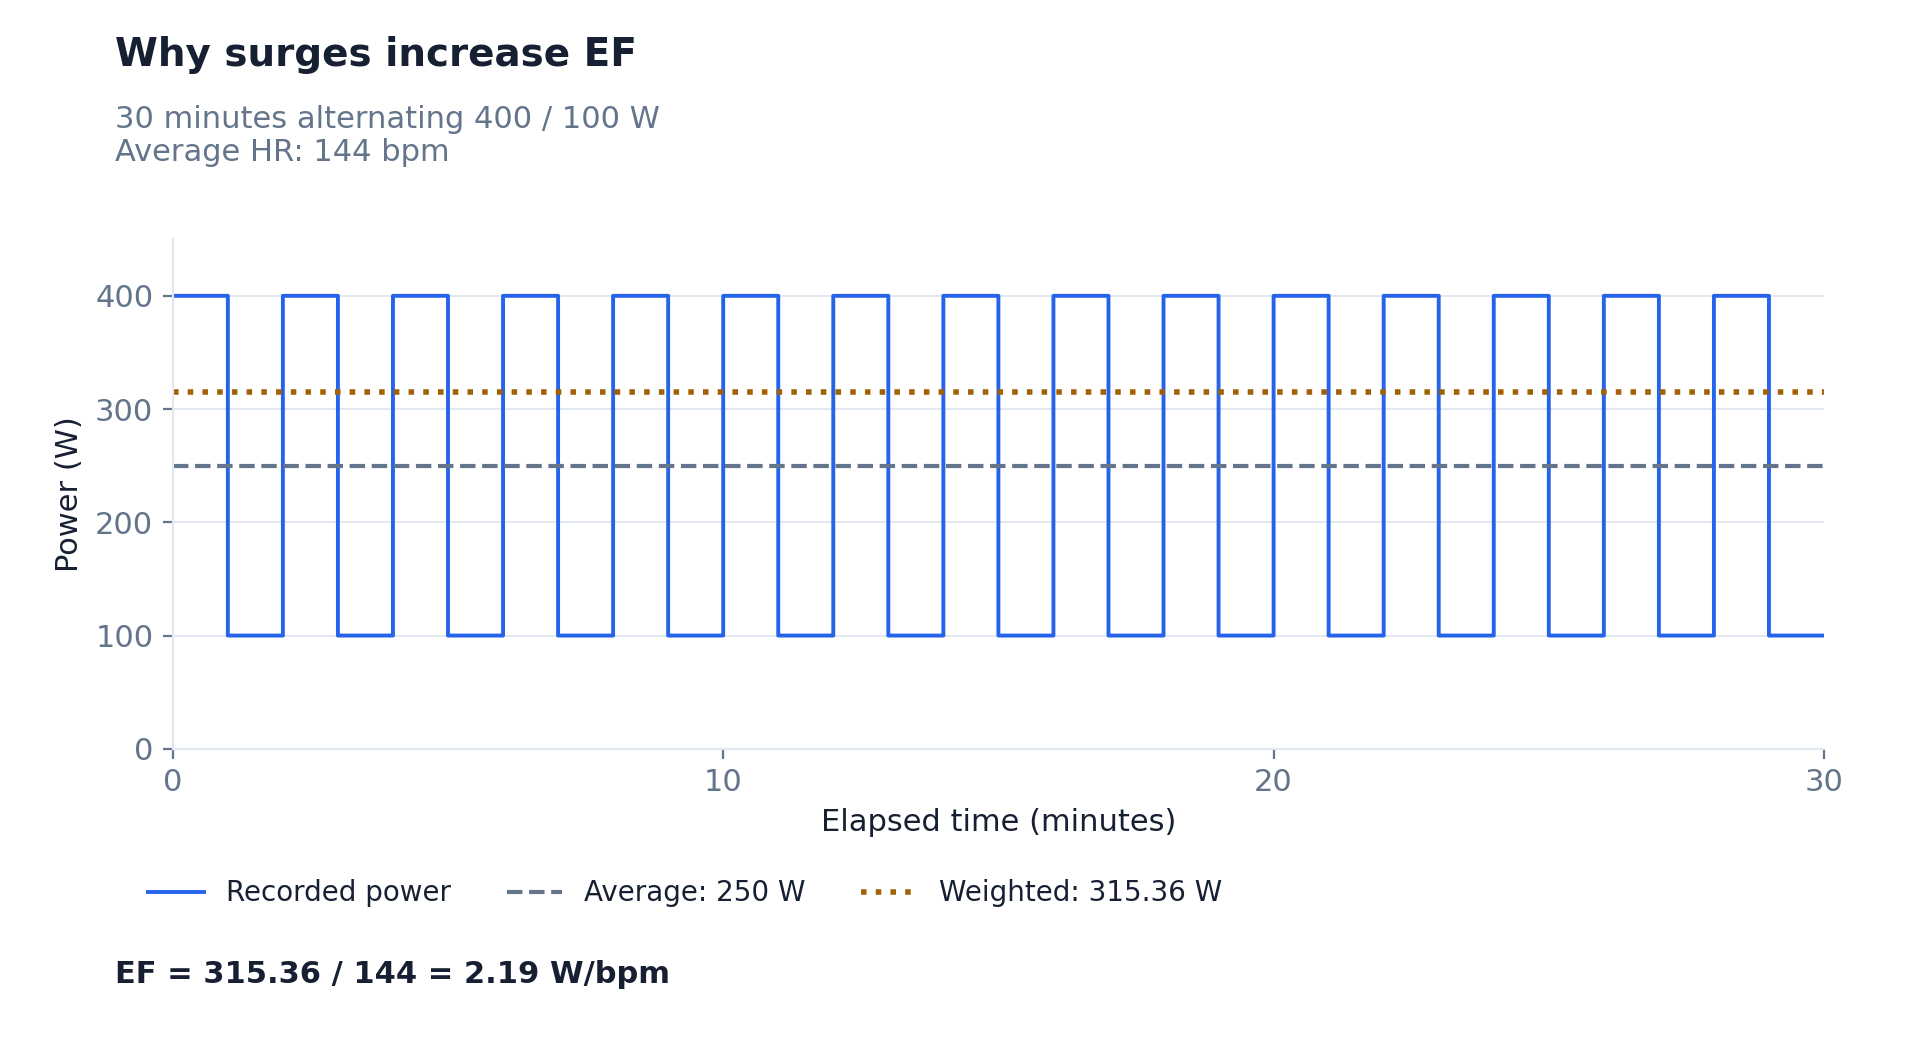
To produce Weighted Power, EffortSignal builds a one-second power sequence from timer-running time and takes complete trailing 30-second averages. It raises each average to the fourth power, averages those results, then takes the fourth root:
Weighted Power = (mean(30-second mean power⁴))^(1/4)Surges therefore contribute more than they would to a simple average. The numerator is not mean watts, peak watts or the mean of second-by-second power/HR ratios. Full details are in Weighted Power.
What EF can tell you about training
For the same rider doing a comparable steady effort, more power at a similar HR—or a lower HR at similar power—produces a higher EF. That describes a change in the output-to-cardiovascular-response relationship. It can be useful when you repeat the same kind of endurance session over time.
The word “efficiency” has a more specific meaning in physiology: mechanical output relative to metabolic energy expenditure. Research measurements commonly use oxygen uptake to estimate that energy cost. EF divides by heart rate, so it does not measure that physiological efficiency. A review of cycling efficiency discusses this distinction in measurement.
HR is affected by more than external output. Temperature, hydration and the duration of exercise can alter it; experiments on prolonged cycling show changes in HR and stroke volume with hydration and environmental conditions. González-Alonso and colleagues A lower HR in one file is therefore not enough to conclude that training fitness improved.
Compare your own recordings with similar duration, intensity, route, equipment and conditions. EF is not an athlete ranking. A high-intensity interval session can generate a large ratio because Weighted Power is high and HR does not follow every short surge immediately. A low-intensity recovery ride can have a smaller ratio without indicating lost fitness.
Compare recordings in the activity table
Open Activities → Settings and enable Power / HR. This column contains the calculated cycling EF, in W/bpm. Average HR, Weighted Power, Duration and Aerobic decoupling give it useful context. The column order and visibility are saved for your account. Click a sortable column heading to change the order of activities.

In the demo, 200 W / 138 bpm = 1.45, while 210 W / 143 bpm = 1.47. Both differ from the drifting ride’s whole-activity EF of 1.39. These are illustrative recordings, not evidence of a real athlete’s seasonal improvement. Use Activity Comparison when you need to inspect selected recordings together, and Activity Analysis to check the streams behind a row.
One EF value does not show when the relationship changed
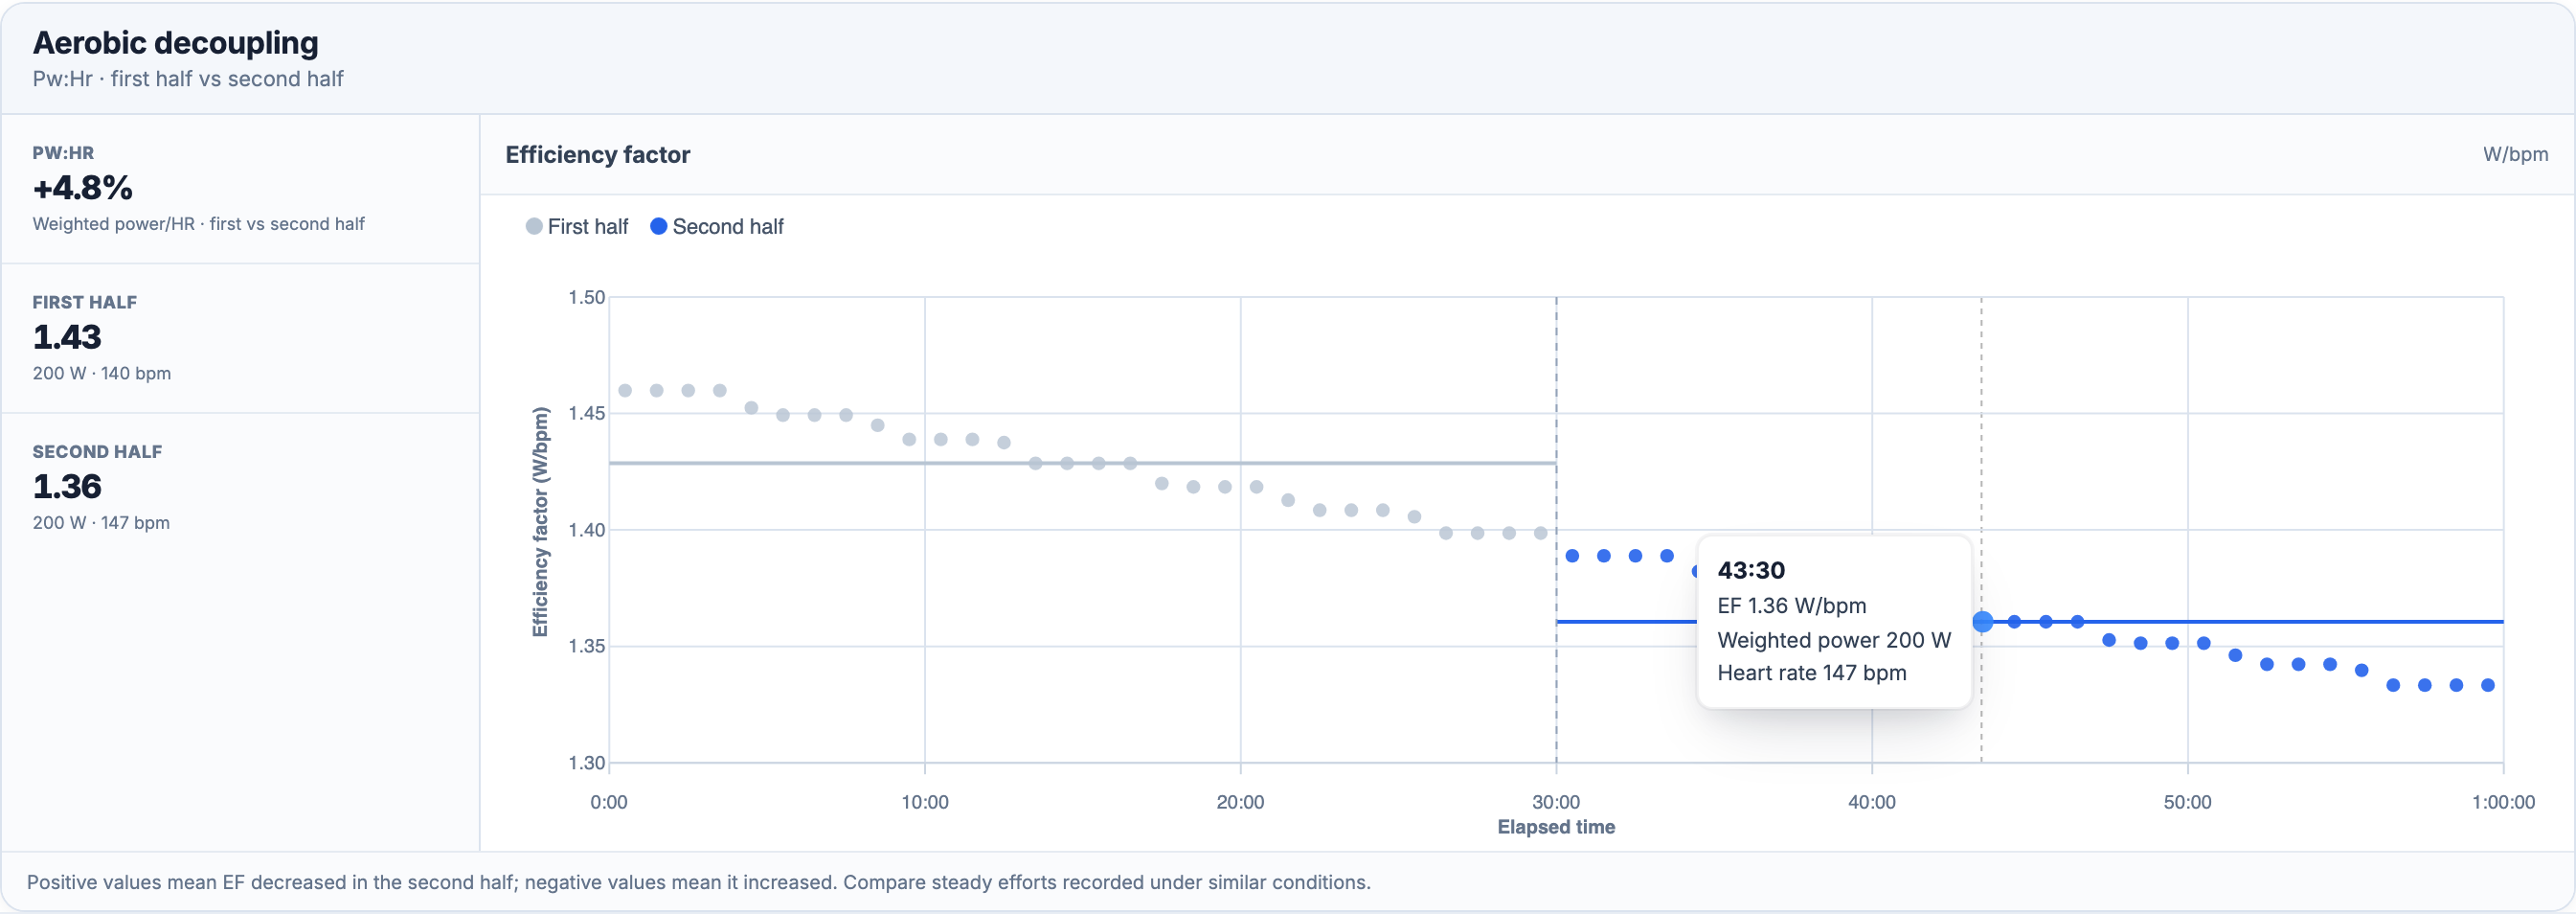
A whole-activity ratio compresses the recording into one number. The steady-hour example has an EF of 1.39 W/bpm, but its first-half EF is about 1.43 and its second-half EF about 1.36. Those halves show a fall during the ride that the single EF value cannot locate.
The Aerobic decoupling block below the Heart rate curve shows this time pattern. Hover over a minute to see its EF, Weighted Power and HR; the half-level lines and percentage come from a separate calculation with stricter requirements for sensor coverage and steady pacing.
What happens with missing data and pauses
For the saved cycling EF, Weighted Power requires at least 80% power coverage and at least one complete 30-second window. Recorded zero watts remain valid coasting samples; missing samples do not become zeros. Power can be held forward for up to ten seconds in the timer-time projection. Paused time is removed before rolling windows are formed, so a window can span the join around a pause.
Average HR comes from the timer-time HR sequence, with gaps of up to five seconds interpolated. A final HR reading can be held for at most five seconds. A missing or nonpositive average HR prevents EF. The saved EF path does not apply the decoupling graph’s 90% paired-coverage requirement or steady-power checks. Check HR Data Coverage, Power Data Coverage and the recording itself even when a ratio is available. Less than ten minutes is marked low confidence in the Weighted Power calculation context.
The saved ratio averages the available power and HR data through their own preparation paths. The decoupling chart instead pairs both streams at each elapsed second before comparing halves. Gaps and pauses can therefore affect the two results differently. Availability means that the calculation produced a value, not that the session is a suitable endurance benchmark.
Running Efficiency Factor has different units
For running, open Terrain & Run Dynamics → Training Metrics → Movement to find Running Efficiency Factor:
Running EF = average speed (m/s) / average HR (bpm)At 5:00/km and 140 bpm, the result is 0.023810 m/s/bpm. EffortSignal uses recorded speed, not a grade-normalized pace metric. A hill can change this ratio without a comparable change in aerobic fitness. The running ratio may be available on terrain where running decoupling is withheld; flat/indoor and duration checks belong to decoupling, not to the ratio itself.
Do not compare the magnitude of a running EF with cycling EF: the numerators and units differ. The current time-based EF graph is expressed in W/bpm and requires power; there is no speed-based counterpart for Pa:HR.
Methodology and sources
This article describes the current EffortSignal implementation, checked September 14, 2026. The numerical examples use the normal activity-metric and chart calculators. External sources explain established terminology and physiology; EffortSignal’s sampling, coverage and display rules are documented separately above.
All Pro features are free through January 31, 2027. No credit card or automatic charges. After Early Access, keep using Free or choose Pro. See Free and Pro plans.