A steady ride can finish at the same power it started with, but with a higher heart rate. Aerobic decoupling measures the change in output relative to heart rate between the two halves. EffortSignal shows the percentage, the inputs for each half and, when power and HR support it, an Efficiency factor graph.
Screenshots use synthetic French and Swiss training recordings in the web app. The explanatory stream diagram is an illustration. Aerobic decoupling is included in Free and Pro.
Open Heart rate and read the graph
Open an activity, select Heart rate, then scroll below Heart rate curve to Aerobic decoupling. The left side shows Pw:Hr, First half and Second half. Each half includes its Efficiency Factor, Weighted Power and average HR. On a phone, the summary sits above the graph.
The horizontal axis is Elapsed time; the vertical axis is Efficiency factor (W/bpm). Grey points belong to the first half and blue points to the second. The dashed vertical line marks the exact halfway point. Two horizontal segments show the half-level EF values used in the percentage calculation.
Hover over a point to read its time, EF, Weighted power and Heart rate together. The points represent approximately one minute each. They are separate observations, so missing minutes remain gaps. The horizontal half-level EF is calculated from that half’s power and HR; it is not an average of the plotted EF points.
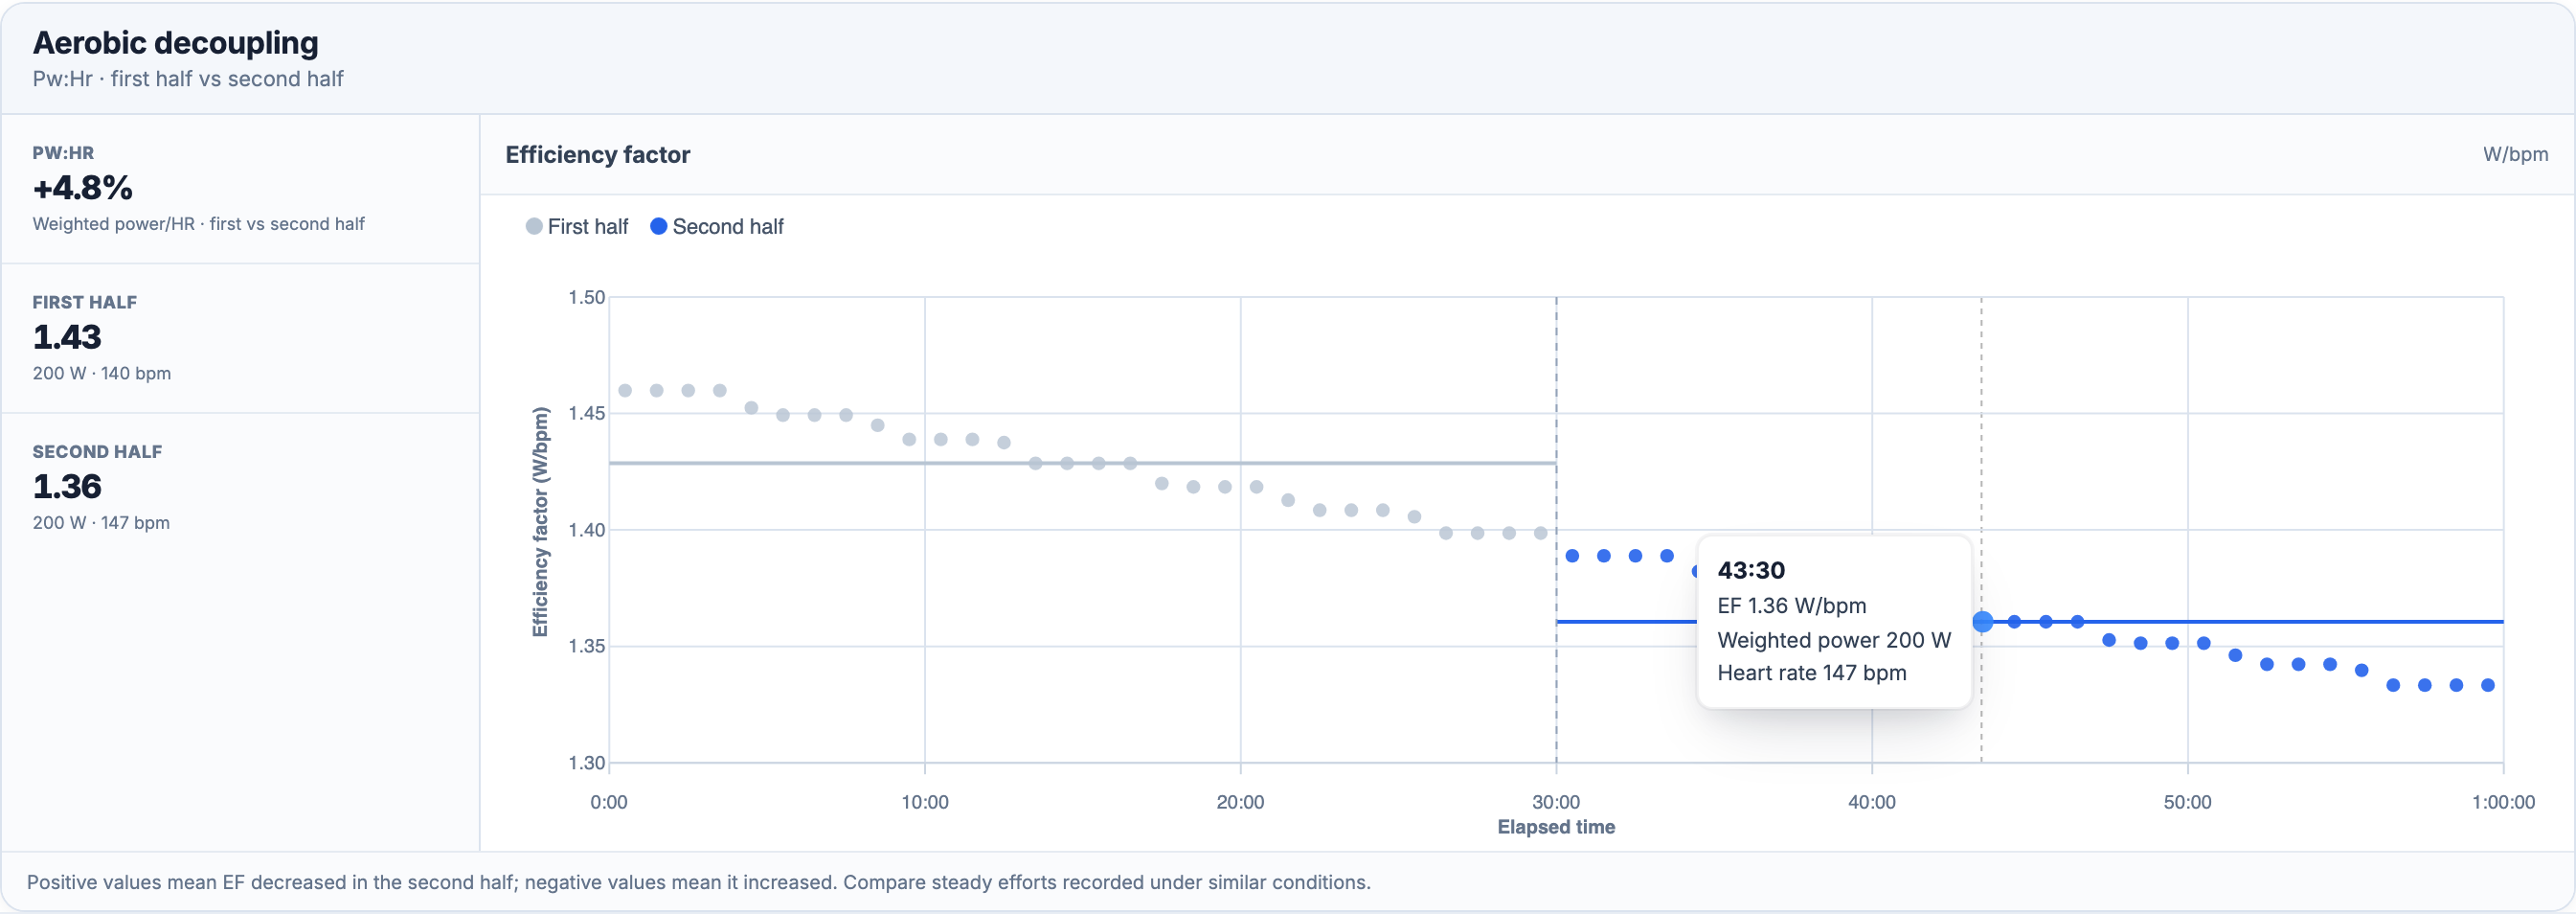
This chart describes the whole recording. It has no zoom toolbar or range control. Selecting a range elsewhere in the activity does not turn it into a new decoupling test, and there is no automatic warm-up removal here. Read the shape of the recording before treating the halves as comparable.
What the change can mean physiologically
Power measures external mechanical output. Heart rate is one part of the cardiovascular response to producing it. During prolonged exercise, heart rate can rise while stroke volume—the amount of blood pumped per beat—falls. This response is often called cardiovascular drift. Coyle and González-Alonso’s review discusses the interacting mechanisms; an activity’s decoupling percentage does not measure stroke volume or identify the cause of the drift.
Heat and hydration can change that response independently of a change in training fitness. In experiments with endurance-trained cyclists, dehydration and environmental temperature affected stroke volume and heart rate. That is a reason to compare conditions, not to diagnose hydration from a graph. González-Alonso, Mora-Rodríguez and Coyle
For repeated, similarly paced endurance sessions, the ratio can help describe how well you maintain the output-to-HR relationship over that duration. A rising percentage can also come from a pacing change, a long warm-up, a different route or bad sensor data. EF is not a direct measurement of oxygen consumption, lactate, metabolic efficiency or aerobic threshold.
Calculate EF for each half, then compare them
For cycling, EffortSignal uses each half’s Weighted Power / average HR. Weighted Power uses complete 30-second rolling averages, raises those averages to the fourth power, averages them and takes the fourth root. Its input and gap handling are described in Weighted Power.
EF1 = first-half Weighted Power / first-half average HR
EF2 = second-half Weighted Power / second-half average HR
Decoupling (%) = (1 − EF2 / EF1) × 100
Using rounded inputs from the example:
| Input | First half | Second half |
|---|---|---|
| Weighted Power | 200 W | 200 W |
| Average HR | 140 bpm | 147 bpm |
| EF | 1.428571 W/bpm | 1.360544 W/bpm |
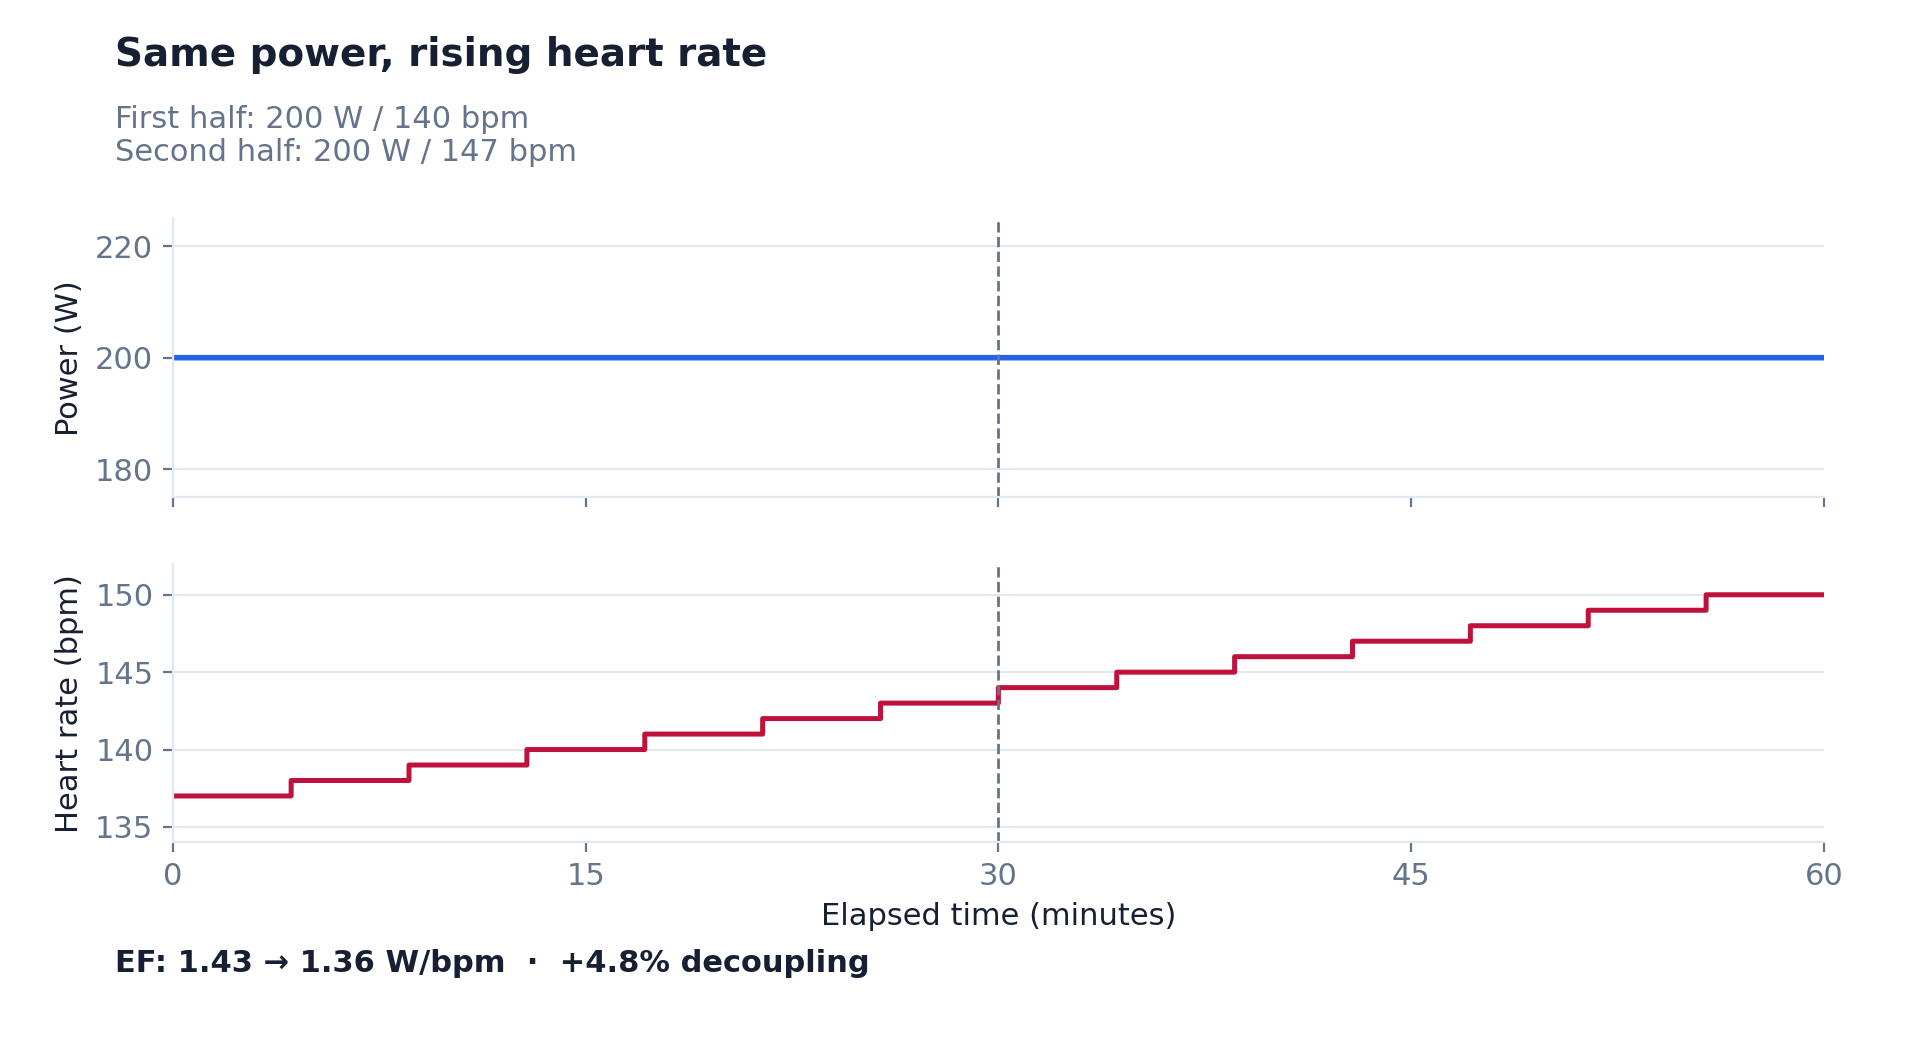
The result is +4.761905%, displayed as +4.8%. The actual recording uses whole-bpm samples with a gradual rise; its unrounded half means are 139.998 and 146.998 bpm, giving the same displayed percentage. Calculations retain more precision than the labels.
Notice that HR increased by 5%, while EF decreased by about 4.76%. Decoupling compares the ratios, so it is not simply the percentage rise in heart rate. Nor does it subtract the displayed, rounded values 1.43 and 1.36.
A positive result means EF was lower in the second half. A negative result means EF was higher; the app displays that result in green. Negative decoupling is not proof that fitness improved during the activity. For example, an easy finish or an unsettled first half can change the ratio. A value near zero can also conceal variation within either half.
When the graph has enough evidence
The time-based Pw:Hr graph has these requirements:
| Check | Current rule |
|---|---|
| Duration | At least 20 minutes of elapsed recording time |
| Paired coverage | Power and positive HR together for at least 90% of each half |
| Valid half values | Positive average power, Weighted Power and average HR in both halves |
| Power variability | Weighted Power / average power no greater than 1.10 in either half |
| Change in pacing | The absolute change in average power between halves no greater than 10% of first-half power |
| Aerobic starting point | First-half average HR inside the configured aerobic HR band |
The HR band is the explicitly named Z2 or Zone 2 if present; otherwise the second configured band, or the only band. The lower bound is included and the upper bound excluded. Only the first half must be inside it: requiring the second half to stay there would hide upward drift that the chart is intended to show.
Recorded samples are placed on an elapsed-time, one-second sequence. A reading is held only until the next record or for at most 30 seconds. Pauses and missing values stay missing. A second without either sensor is excluded from both sides of the EF ratio. Recorded zero watts count as sensor coverage, though repeated coasting can fail the steady-power checks.
The midpoint is half the elapsed sequence, rounded down to a whole second. Each half’s Weighted Power uses complete windows contained in that half. One-minute points also stop at the exact midpoint and need 90% paired coverage plus a complete 30-second power window. This calculation does not shift HR to compensate for its delayed response to power.
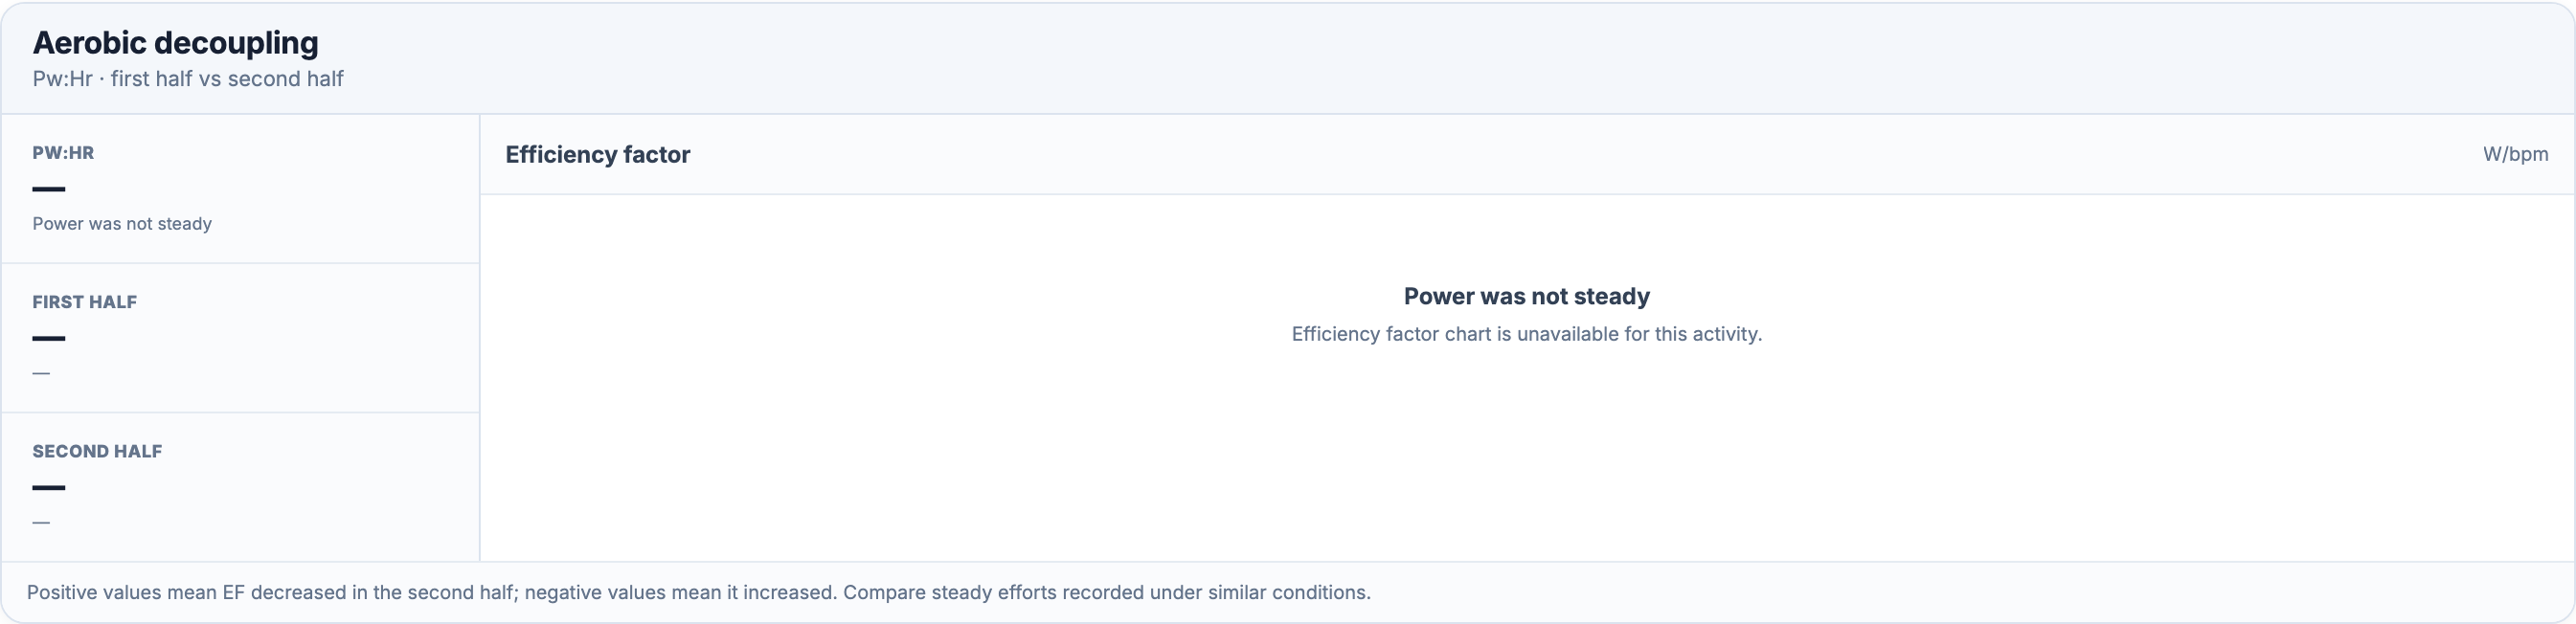
Other messages include Needs at least 20 min, Pauses or sensor gaps, Aerobic zone unavailable and First half was not aerobic. If power and HR were never recorded together, the entire block is omitted. An unavailable percentage is not zero drift.
Pa:HR uses running speed, not minutes per kilometre
Open a running activity’s Terrain & Run Dynamics tab and find Training Metrics → Movement. The Aerobic Decoupling row uses average speed in m/s / average HR for each half, then the same percentage formula. It does not divide a time-per-distance pace by HR, and it does not use Normalized Graded Pace. These distinctions matter when comparing values with another platform.
At 5:00/km, speed is 3.333333 m/s. If that speed stays constant while half-level HR rises from 140 to 147 bpm, the ratio falls from 0.023810 to 0.022676 m/s/bpm, again giving about +4.76% decoupling.
For running decoupling, EffortSignal requires at least 20 minutes of timer time, 80% speed coverage and 90% HR coverage. The run must be indoor or have at least 80% of valid grade values within ±2%. Outdoor recordings without enough evidence of flat terrain are marked terrain-sensitive. Running Efficiency Factor can remain available while decoupling is unavailable.

Why a table value can differ from the chart
The saved Aerobic Decoupling metric in Training Metrics and the activity table has a different preparation and eligibility path from the dedicated Pw:Hr graph. The saved cycling metric uses compressed timer time, at least 80% power coverage and 90% HR coverage, configured power zones, and at least half of classified power samples in zones 1–3. It does not apply the graph’s 1.10 variability limit, 10% pacing limit or initial HR-zone check.
Both use the first-minus-second EF formula. They can agree on a complete, steady recording, but pauses, missing samples or different zone requirements can produce different availability or values. In the current app, treat the graph’s percentage and its two displayed halves as one calculation. Do not assume a populated table cell means the graph’s stricter requirements passed.
The Power / HR scatter plot in the Power tab is also a separate analysis. It fits power against HR and can account for HR lag; Power @ same HR drift is a regression comparison, not classic Pw:Hr. Read its own labels rather than interchanging the two percentages.
Use the percentage with the recording
Compare similar durations, pacing, sensor setups and conditions. A one-hour ride and a three-hour ride do not ask the same endurance question. Inspect any obvious warm-up, long descent, stop or interval block before interpreting a half split.
The often-quoted 5% boundary is a coaching rule of thumb, not an EffortSignal pass/fail limit or a physiological diagnosis. TrainingPeaks describes that convention. EffortSignal displays the calculated value and the eligibility reason; it does not infer a new FTP, aerobic threshold or training prescription from it.
Methodology and sources
The formulas, quality checks and UI behavior above were checked against current EffortSignal code on September 14, 2026. The worked recording and numerical examples were passed through the application’s calculators. The physiological references explain the background; they do not validate EffortSignal’s particular coverage limits or zone rules.
All Pro features are free through January 31, 2027. No credit card or automatic charges. After Early Access, keep using Free or choose Pro. See Free and Pro plans.