# Ramp Rate
Canonical HTML: https://effortsignal.com/features/ramp-rate/
Last content update: 2026-09-14
Ramp Rate measures how much CTL has risen or fallen over seven days. It helps you follow the build-up of recorded training load across a block. In EffortSignal, inspect the Fitness line in Dashboard, then open a completed week's details in Calendar: the change beneath CTL shows that week's increase or decrease.
Screenshots use the same synthetic French and Swiss training history as the ACWR and TSB guides. The separate CTL diagram is an explanatory illustration. Training load, fitness, fatigue and form are included in Free and Pro.
Follow the Fitness line in Dashboard
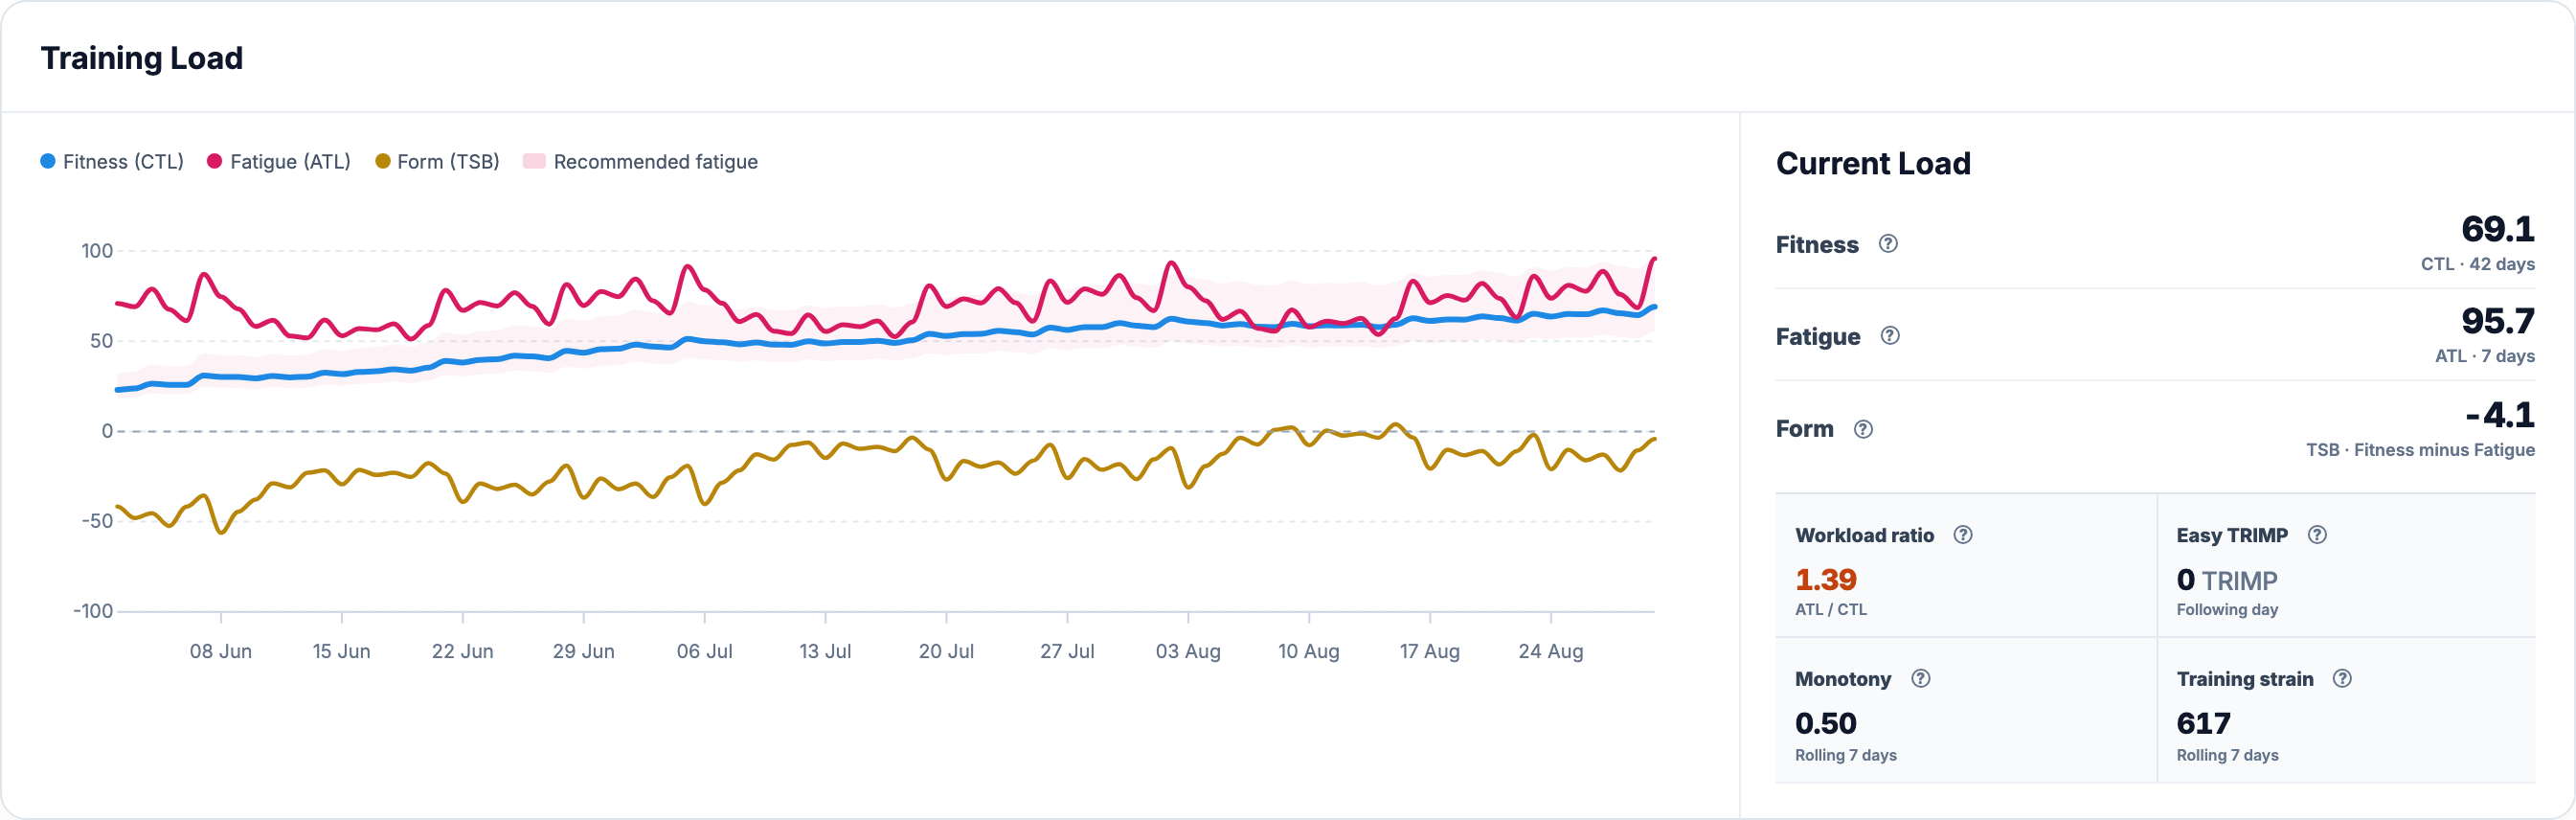
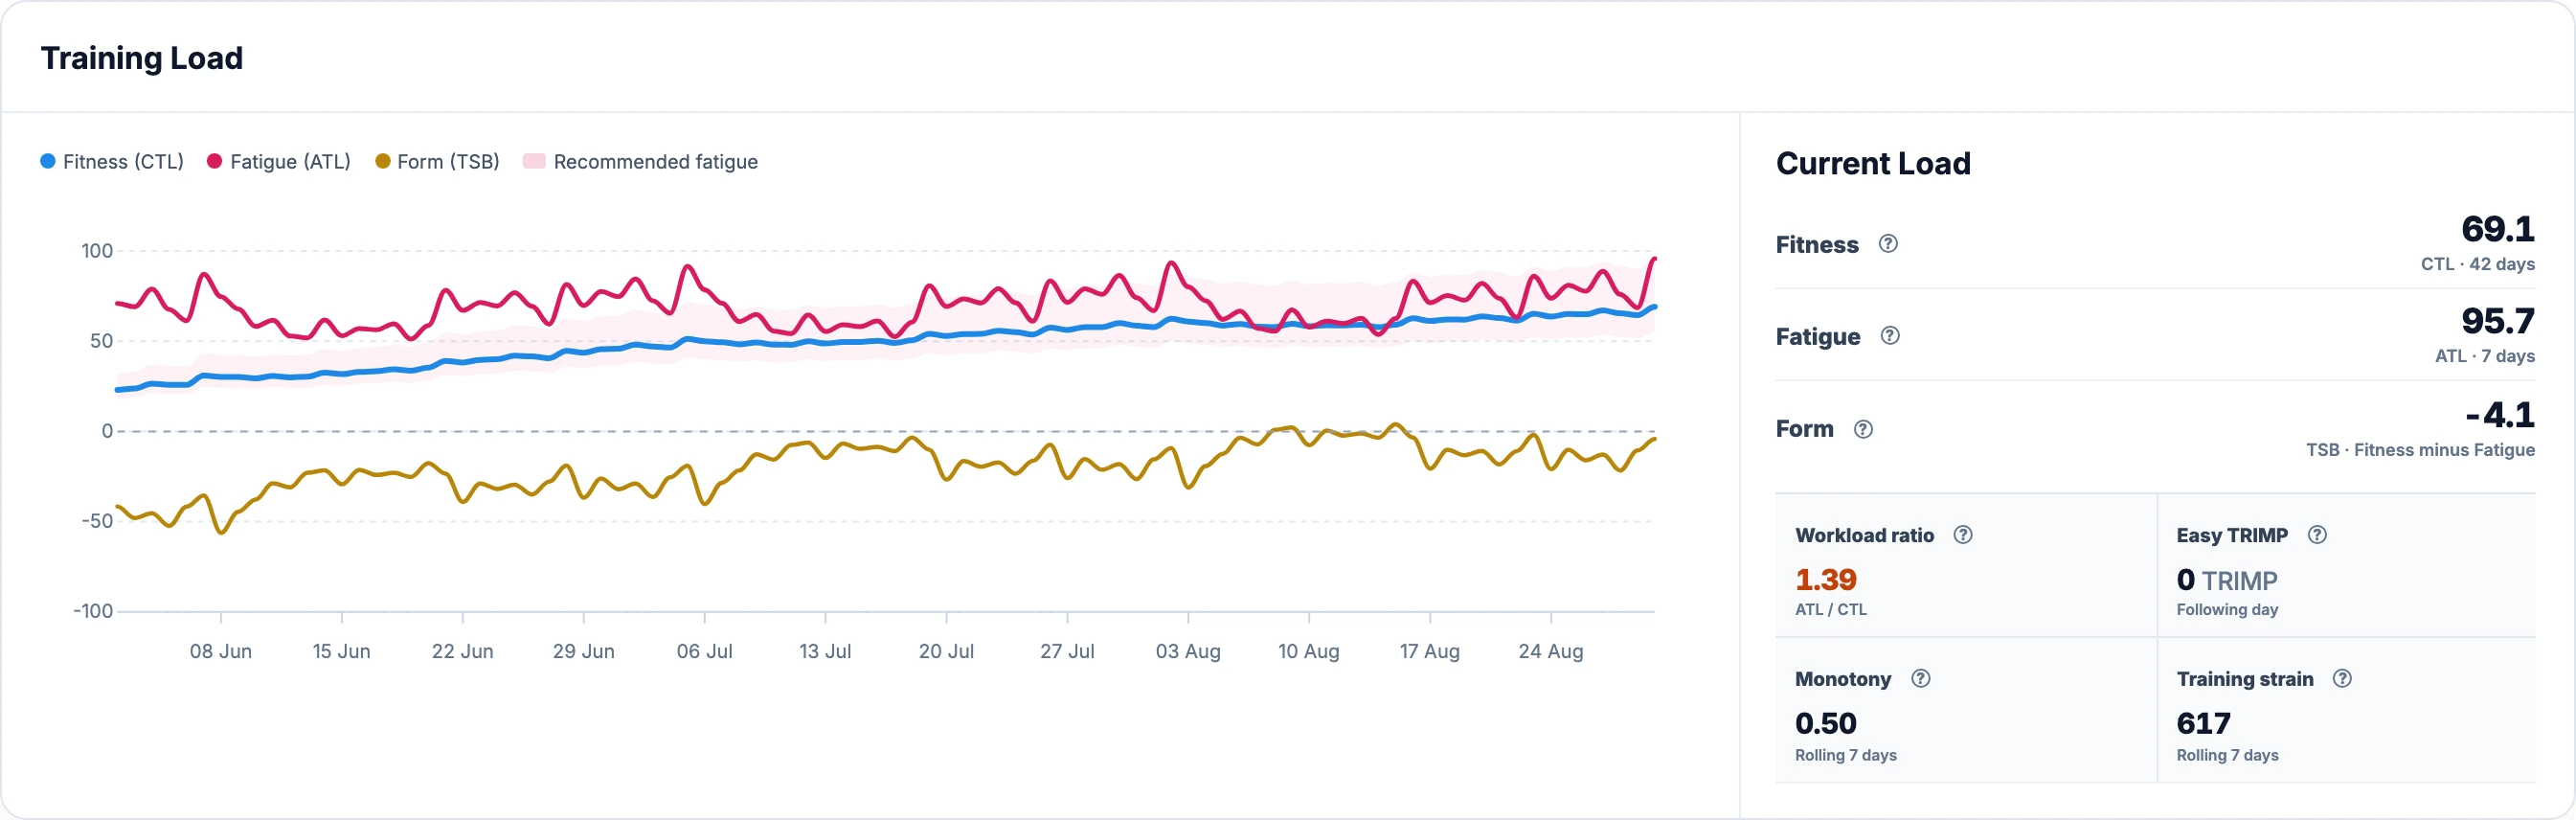
Open **Dashboard → Training analytics → Training Load**. The blue **Fitness (CTL)** line is the slower-moving load estimate. On desktop, **Current Load** sits to the right of the graph; on a phone, it follows below. The graph also shows Fatigue (ATL) and Form (TSB), so you can see how quickly recent load is changing relative to the longer history.
Use the date control beside the Dashboard title to choose a historical endpoint. **42D, 3M, 6M, 1Y and 2Y** change the displayed history. They leave the calculation unchanged. Hover over a measured line, or touch it on a phone, to inspect the date and available values. Compare CTL on the selected date with CTL **seven calendar days earlier**.
[](/marketing/product/catalog-acwr-dashboard-desktop.png)
The blue line ends at CTL 69.1 on 30 August. One week earlier it was 65.2. EffortSignal calculates Ramp Rate in its daily load history, but the current Dashboard has no separate card or line labelled Ramp Rate.Enlarge the Dashboard load history
Seven-day CTL change, in points per week
EffortSignal calculates the daily value as:
```text
Ramp Rate[d] = CTL[d] − CTL[d−7]
```
It is an **absolute change in CTL points per week**. CTL 50 rising to 54 gives a Ramp Rate of **+4**. It is not a 4% increase: the percentage change would be 8%. It is also different from subtracting one week's total TRIMP from another week's total.
CTL itself is an exponentially weighted estimate of daily [TRIMP](/learn/trimp/):
```text
CTL[d] = CTL[d−1] + (daily TRIMP[d] − CTL[d−1]) / 42
```
The coefficient is exactly **1/42**. TRIMP combines available heart-rate evidence, duration and the applicable athlete settings. CTL has the scale of TRIMP per day, so Ramp Rate describes the change in that daily-load estimate over a week. Recorded cycling, running and other sports can contribute. PSS is a separate power-based load metric and does not replace missing TRIMP in this calculation.
Both CTL endpoints include the load assigned to their respective local dates. The model uses calendar days, including rest days; it does not wait for seven workouts. Choosing **42D** in the interface does not turn Ramp Rate into a 42-day change. The [CTL reference](/learn/ctl/) covers how the older history fades.
A build week followed by a lighter week
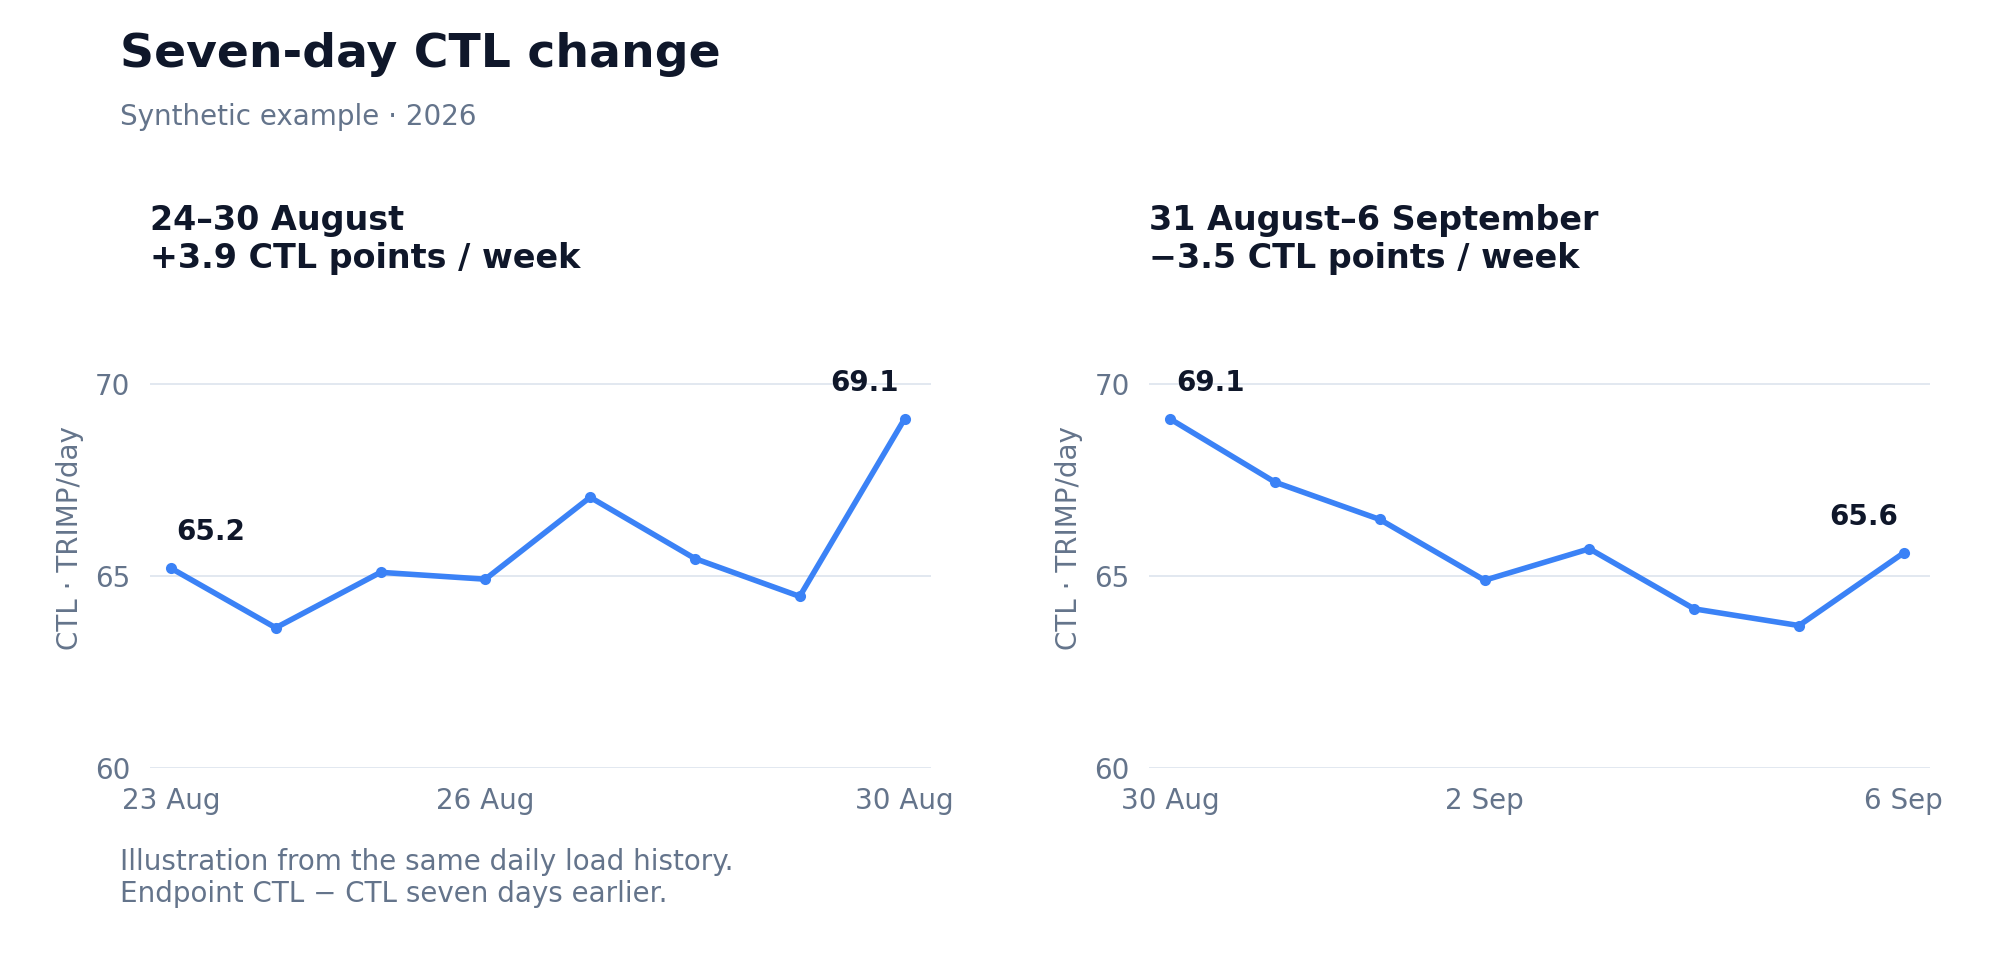
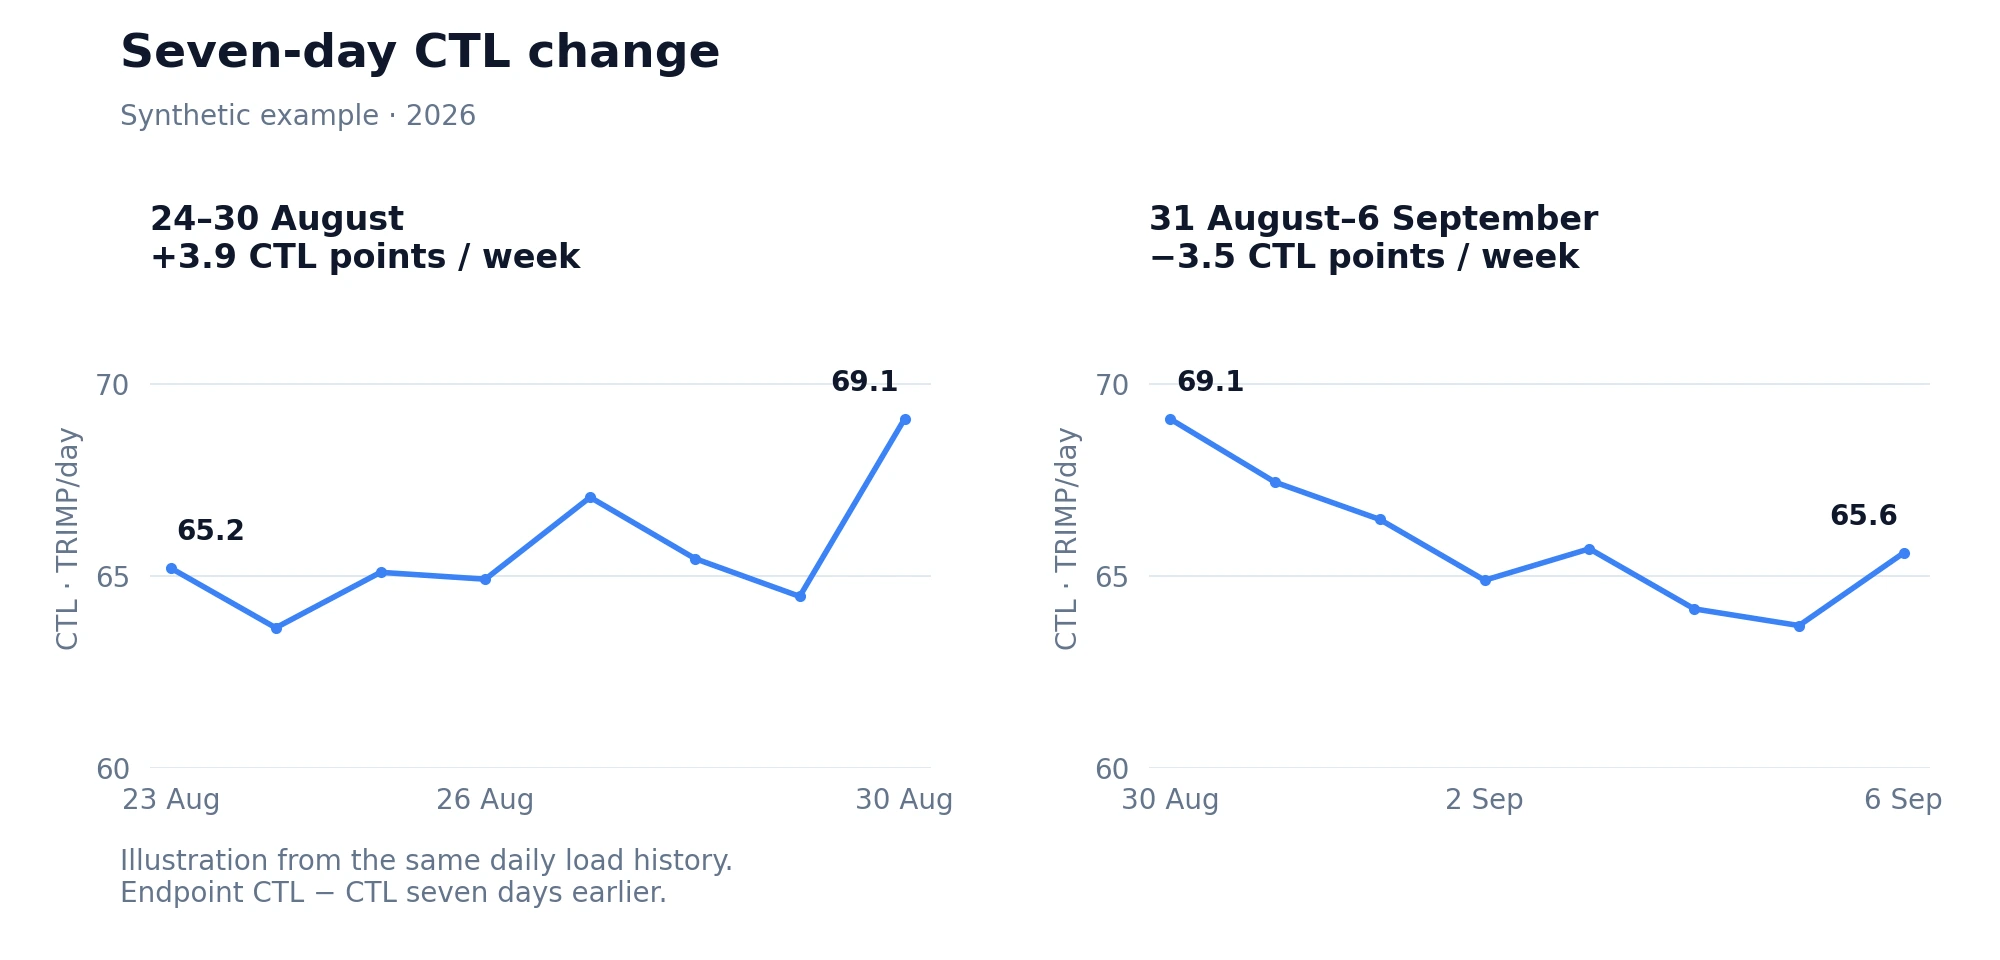
The demo contains two adjacent completed weeks. This diagram uses the same stored daily CTL values as the screenshots, with matching vertical scales:
[](/marketing/product/catalog-ramp-change-desktop.png)
Illustration, not an additional app chart. The first comparison is 23–30 August; the second is 30 August–6 September. Eight daily points delimit each seven-day change.Enlarge the seven-day CTL illustration
On **30 August**, CTL is **69.088381**, up from **65.203535** on 23 August. The difference is **+3.884846**, displayed as **+3.9** in the completed week's CTL change.
On **6 September**, CTL is **65.603542**. Subtracting 30 August's value gives **−3.484839**, displayed as **−3.5**. The athlete still recorded 5h 05m of training that week; CTL can fall when recent daily load is lower than the existing average. A negative Ramp Rate does not require a week with no activity.
Calculations use unrounded values. Subtracting the one-decimal CTL labels can therefore differ slightly from the displayed change.
Find the same change in Calendar's Week Details
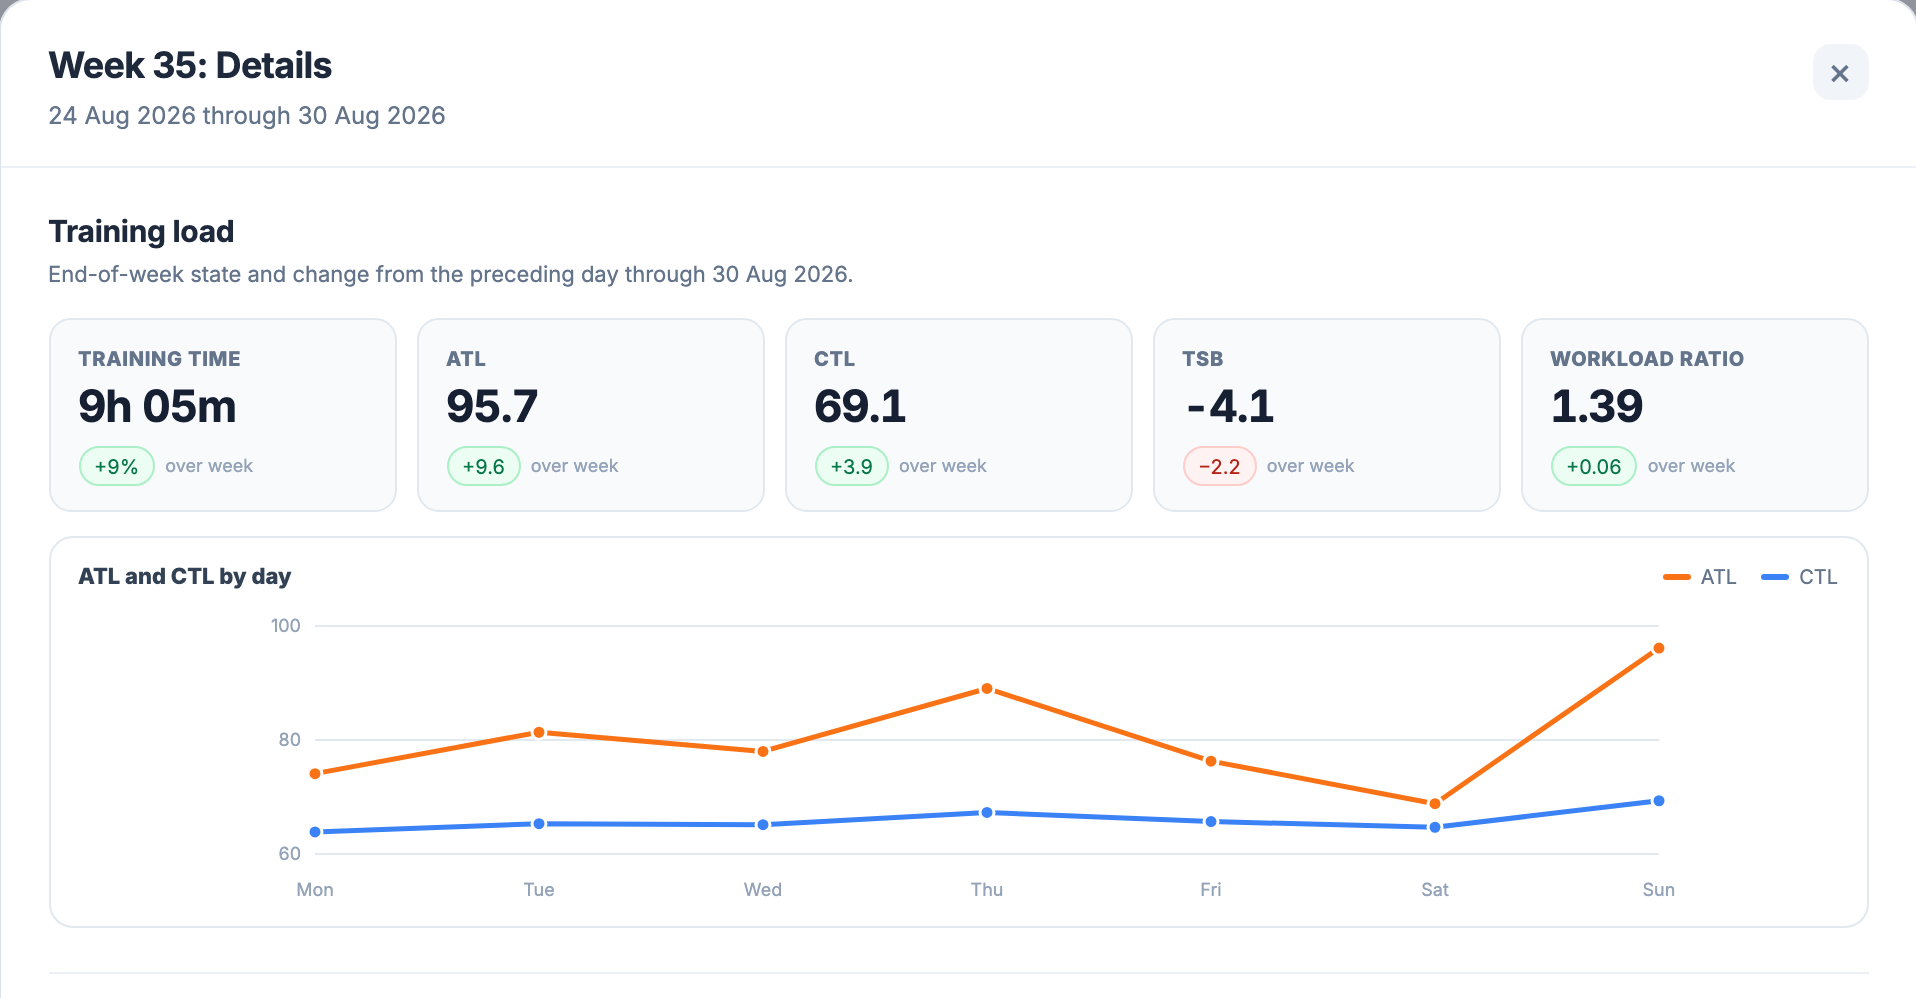
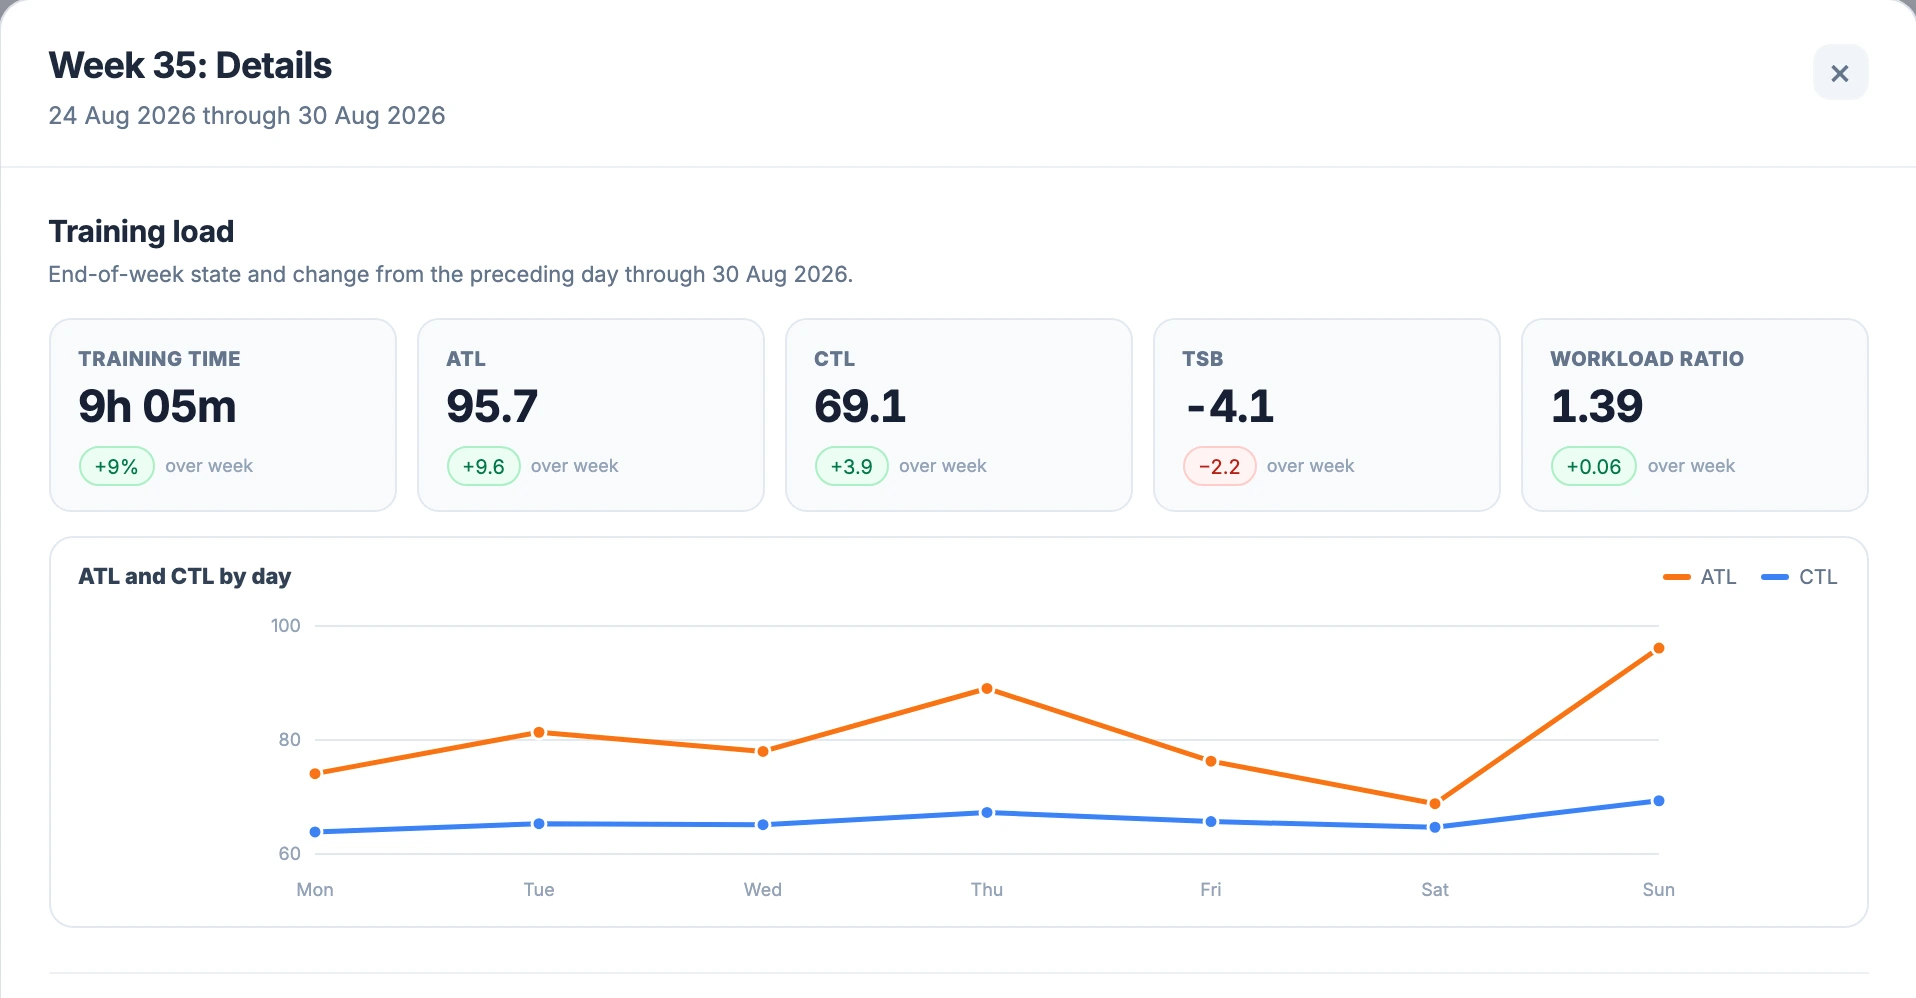
Open **Calendar** and browse to **24–30 August**. The week summary shows **9h 05m completed**, CTL and TSB. Select its duration-and-load area to open **Week 35: Details**. On a phone, navigate to that week and select the same summary.
In the **Training load** section, find the **CTL** card. Its main value is **69.1**, with **+3.9 over week** beneath it. The small **ATL and CTL by day** graph shows how the two estimates moved during the week. It does not plot Ramp Rate itself.
[](/marketing/product/catalog-acwr-week-desktop.png)
For this completed week, the CTL change compares Sunday 30 August with Sunday 23 August. Those endpoints are exactly seven days apart, so the change equals Ramp Rate.Enlarge the build week's CTL change
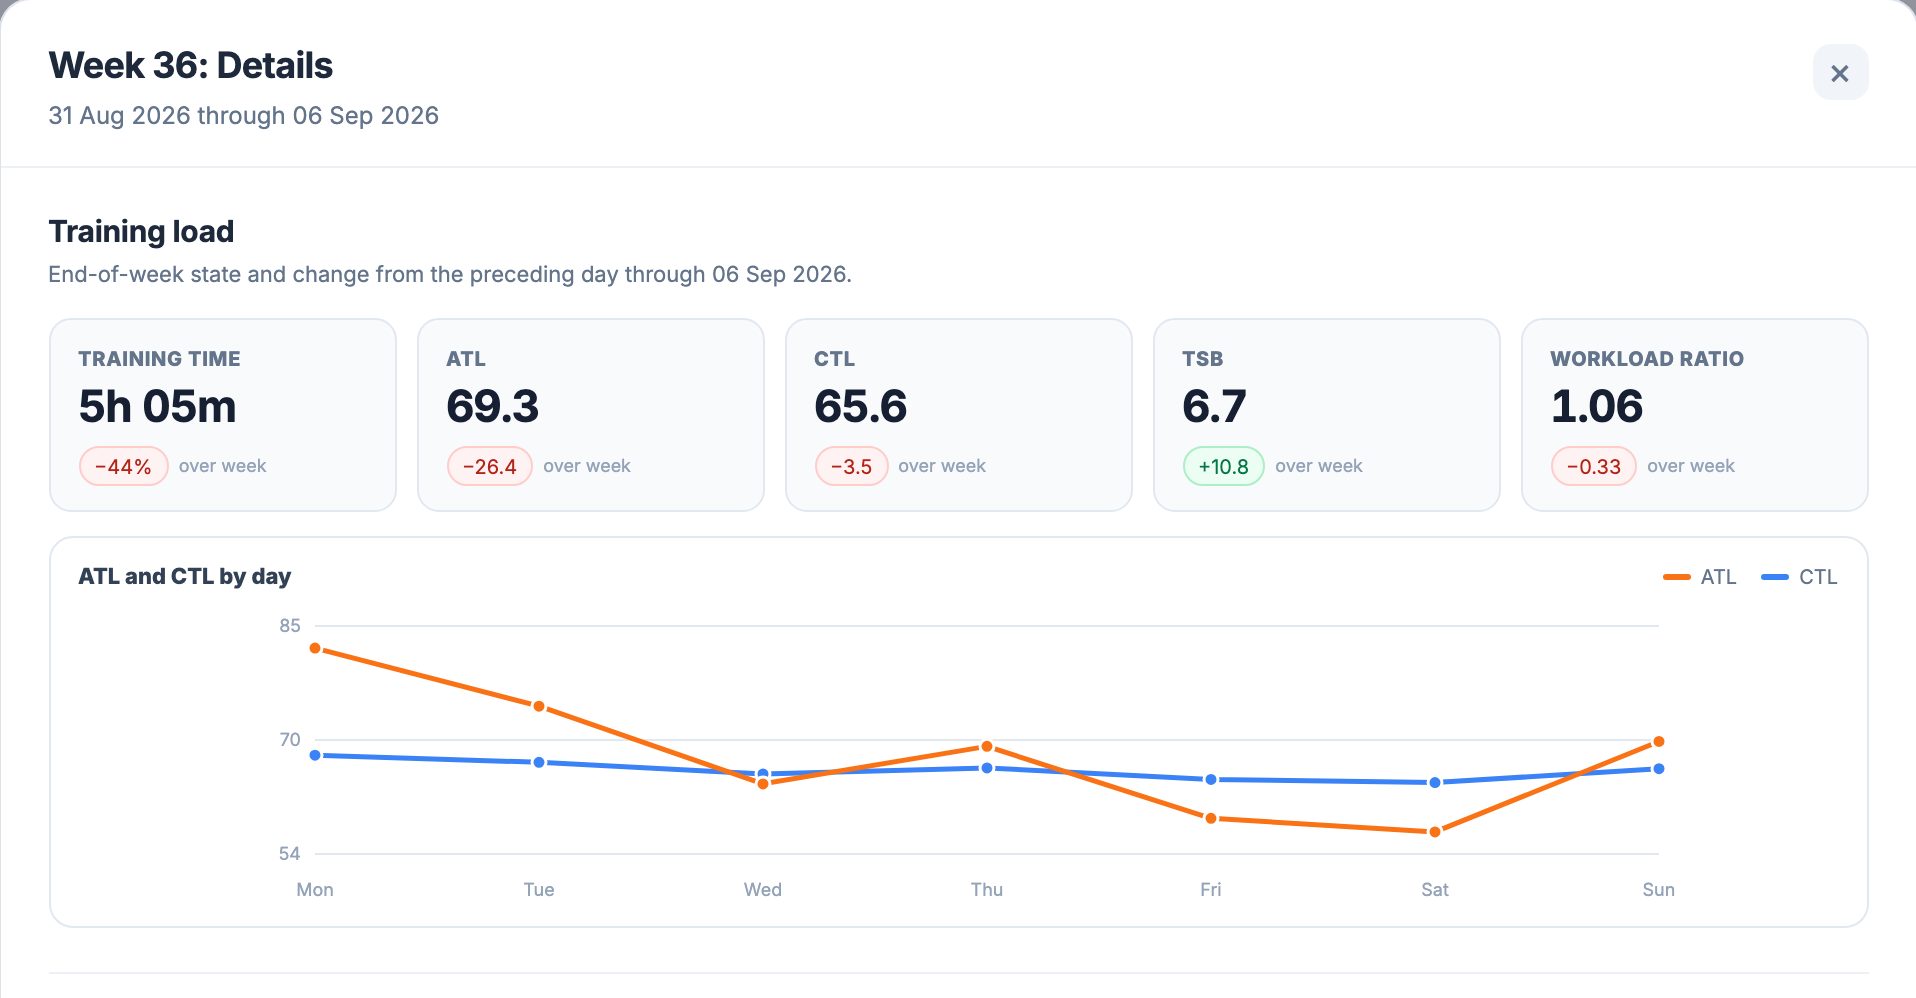
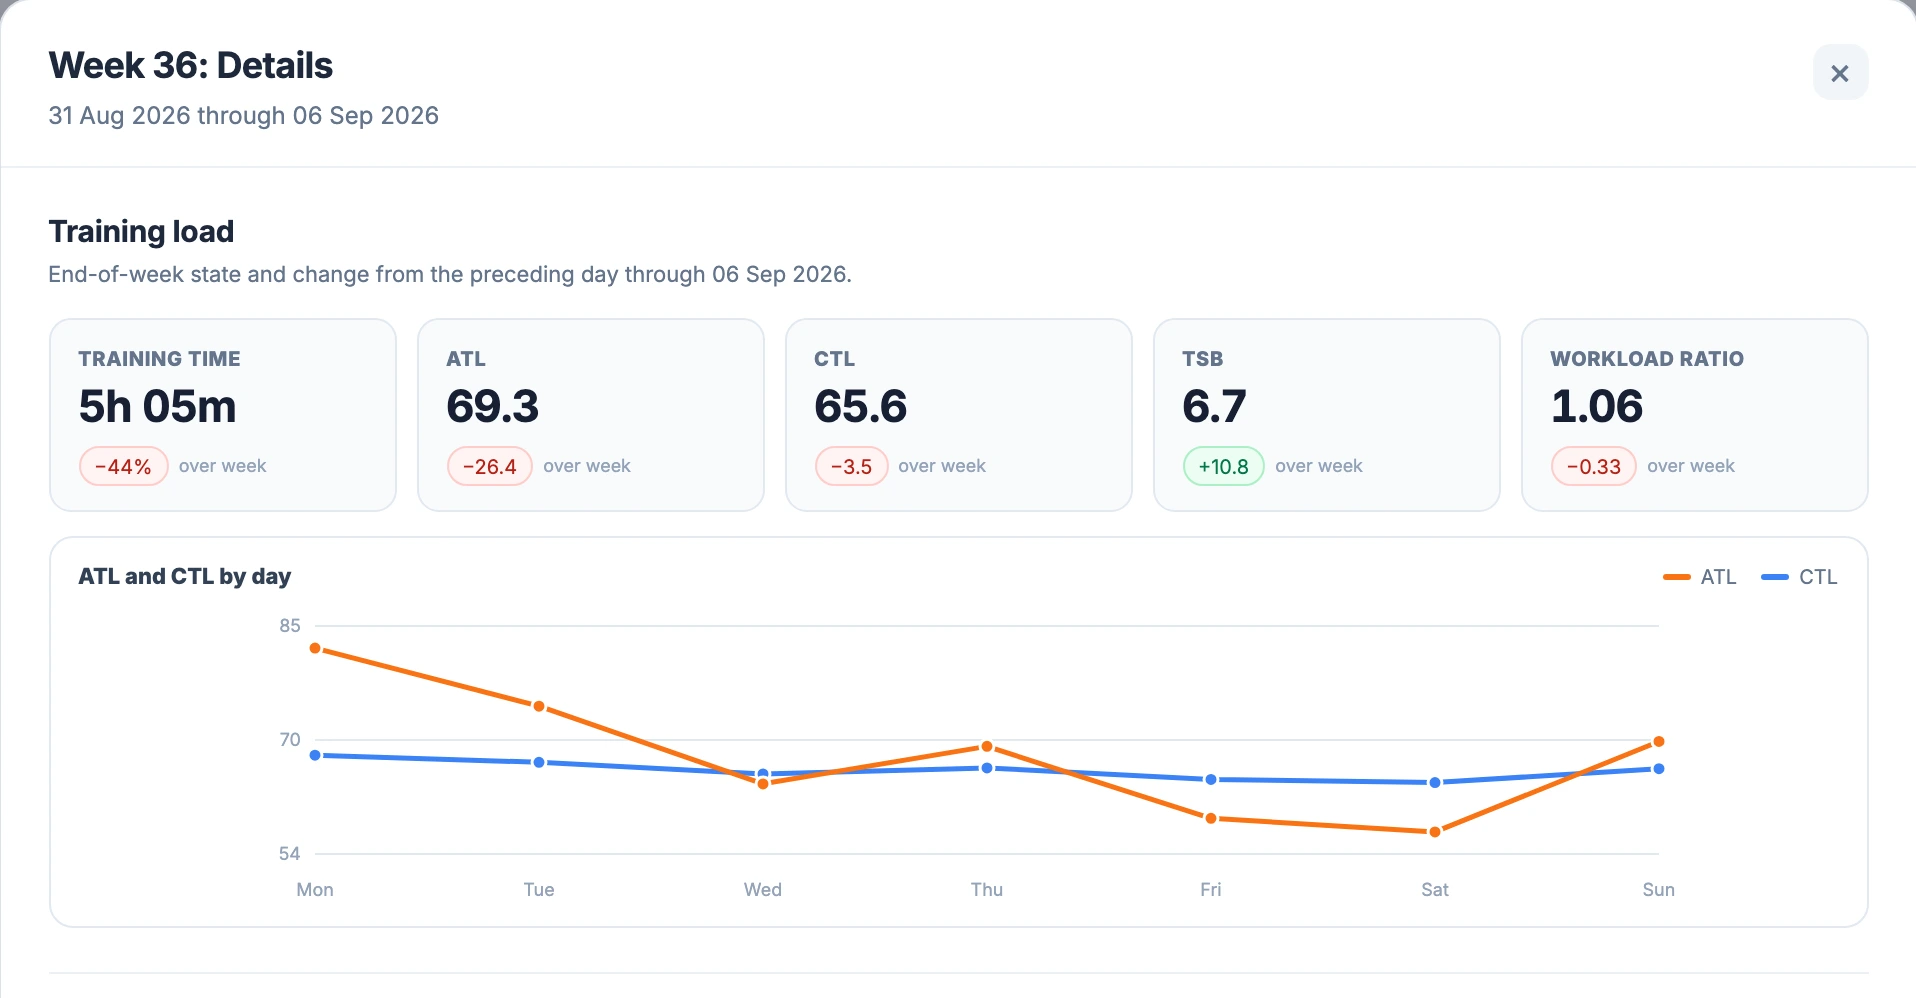
Close the dialog with ×, **Close** or Escape, then open the following week. Its **CTL 65.6 / −3.5 over week** shows the reduction. The nearby ATL, TSB and Workload ratio cards help explain the same period from different angles.
[](/marketing/product/catalog-tsb-week-desktop.png)
During the lighter week, CTL falls 3.5 points while ATL falls 26.4 and TSB rises 10.8. Green and red badges indicate numerical direction; they do not grade the week.Enlarge the lighter week's CTL change
A week in progress has a different comparison
Calendar's **over week** change compares the latest available date within that week with the day before the week began. For a completed seven-day week with both endpoints available, that matches Ramp Rate. During a week in progress, the elapsed period is shorter. Check the dialog's **through** date before treating its CTL change as a seven-day value.
For example, on **Wednesday 2 September** in the demo:
| Comparison | Earlier CTL | Current CTL | Change |
| --- | --- | --- | --- |
| Calendar week to date: 30 Aug → 2 Sep | 69.0884 | 64.8893 | −4.1991 |
| Rolling seven days: 26 Aug → 2 Sep | 64.9166 | 64.8893 | −0.0274 |
Both describe the same endpoint. They differ because they start on different dates. The first value is not extrapolated to a full week. Week boundaries follow the account's week-start preference; the rolling calculation always looks seven dates back. **No prior-day baseline** means Calendar cannot calculate its weekly change.
Use Ramp Rate to review the build-up of load
Across a training block, a sequence of positive weekly changes shows that CTL has been rising. Open the contributing weeks to see whether that came from longer rides, more sessions or higher cardiovascular load. Then compare the block with session results and [Progress](/features/progress/). CTL describes recorded load; it does not demonstrate improved power or race performance.
A recovery week or taper can produce a negative change, as the demo shows. Read that reduction against the purpose of the week and your [check-ins](/features/check-ins-notes/). Adding work solely to keep CTL rising can defeat the purpose of a lighter schedule.
Ramp Rate also depends on where CTL starts. As a calculation example, start at **CTL 50** and apply **100 TRIMP on each of seven days**. CTL reaches **57.7612**, a **+7.7612** change. Start at CTL 100 with the same daily load and CTL stays at 100: Ramp Rate is zero. This is the arithmetic of the average, not a proposed training week.
Why there is no universal weekly target here
TrainingPeaks coaching material discusses weekly CTL targets, including Joe Friel's suggested **5–8 points per week** in a TSS-based model. That is a coaching guideline in its original context. EffortSignal builds this CTL history from **TRIMP**, so the numerical target should not be transferred directly between the two load scales. [Joe Friel: Why Ramp Rate is an Important Training Metric](https://www.trainingpeaks.com/learn/articles/why-ramp-rate-is-an-important-training-metric/)
EffortSignal does not apply a Ramp Rate target or traffic-light band in these views. A single weekly change cannot establish a safe progression rate, recovery state or injury probability. Duration, intensity distribution, sport and the athlete's response provide context that the CTL difference omits.
Scheduling a workout or moving it to another day does not forecast its effect on this recorded-load curve. [Week Planner](/features/week-planner/) and [Training Calendar](/features/training-calendar/) organise the plan; the completed activity's available TRIMP contributes to CTL after recording and calculation.
Ramp Rate, ACWR and TSB
**Ramp Rate** compares CTL with its own value seven days earlier. **[ACWR / Workload ratio](/features/acwr/)** divides the selected day's ATL by CTL. **[TSB / Form](/features/tsb/)** subtracts the preceding day's ATL from CTL. Their dates and units differ.
On 6 September, the demo therefore has **Ramp Rate −3.5**, **Workload ratio 1.06** and **Form +6.7**. CTL has fallen over the week, Sunday's ride has lifted updated ATL slightly above CTL, and Form still reflects the balance entering Sunday. Reading the three together is more informative than treating their signs or colours as interchangeable.
Short history and missing recordings
The model starts from zero. If CTL seven days earlier is missing, the Ramp Rate calculation currently uses zero for that earlier value. This affects the **first seven model days** in particular: the result then equals current CTL, without a full observed seven-day baseline. The **first 41 days** carry low-confidence context while history builds.
Rest days contribute zero TRIMP. An activity without usable HR can leave its contribution incomplete, while a missing import can look like a day off. PSS does not fill those gaps. Backdated imports, corrected inputs and timezone changes can alter later CTL values and their seven-day differences. The full activity is assigned to its local start date, including a recording that crosses midnight. See the [training-load methodology](/learn/training-load/) for preparation and recalculation rules.
Calculation and screenshot sources
The formula and interface were checked against current EffortSignal code on September 14, 2026. All 119 daily Ramp Rate values in the isolated demo history were checked against their CTL endpoints. The screenshots show the existing Dashboard and Week Details views; the two-panel illustration uses those same stored CTL values. The TrainingPeaks article supplies terminology and coaching context, while the exact TRIMP calculation and UI behaviour above describe EffortSignal.
All Pro features are free through January 31, 2027. No credit card or automatic charges. After Early Access, keep using Free or choose Pro. [See Free and Pro plans](/pricing/).