# Cycling Dynamics
Canonical HTML: https://effortsignal.com/features/cycling-dynamics/
Last content update: 2026-09-14
Open a ride's Performance tab to inspect how each leg delivered power. Visual shows crank diagrams, pedal offsets and left/right summaries; Graphs shows how the recorded values changed through the ride. Zoom into a climb or interval to update the summaries for that section. The available metrics depend on what your pedals and recording device saved.
These are screenshots of EffortSignal's web analytics using a synthetic French climbing session. Sensor charts are included in Free and Pro. Seated/standing analysis is not currently available; the limitation is explained below.
Find Pedalling efficiency inside Performance
Open a completed cycling activity and select **Performance** above the charts. Scroll to **Pedalling efficiency**. Its **Visual / Graphs** switch changes the presentation of the same recorded channels. Other performance charts, such as Performance Condition, can appear above this section.
Visual groups the data into **Power phase & balance**, **Platform center offset** and **Stroke quality**. The header identifies the selected time range and the number of recorded samples used. With the whole ride selected, the demo has **3,600 samples**. That is a count of sensor records carrying dynamics data, not a count of pedal revolutions.
[](/marketing/product/catalog-cycling-phase-desktop.png)
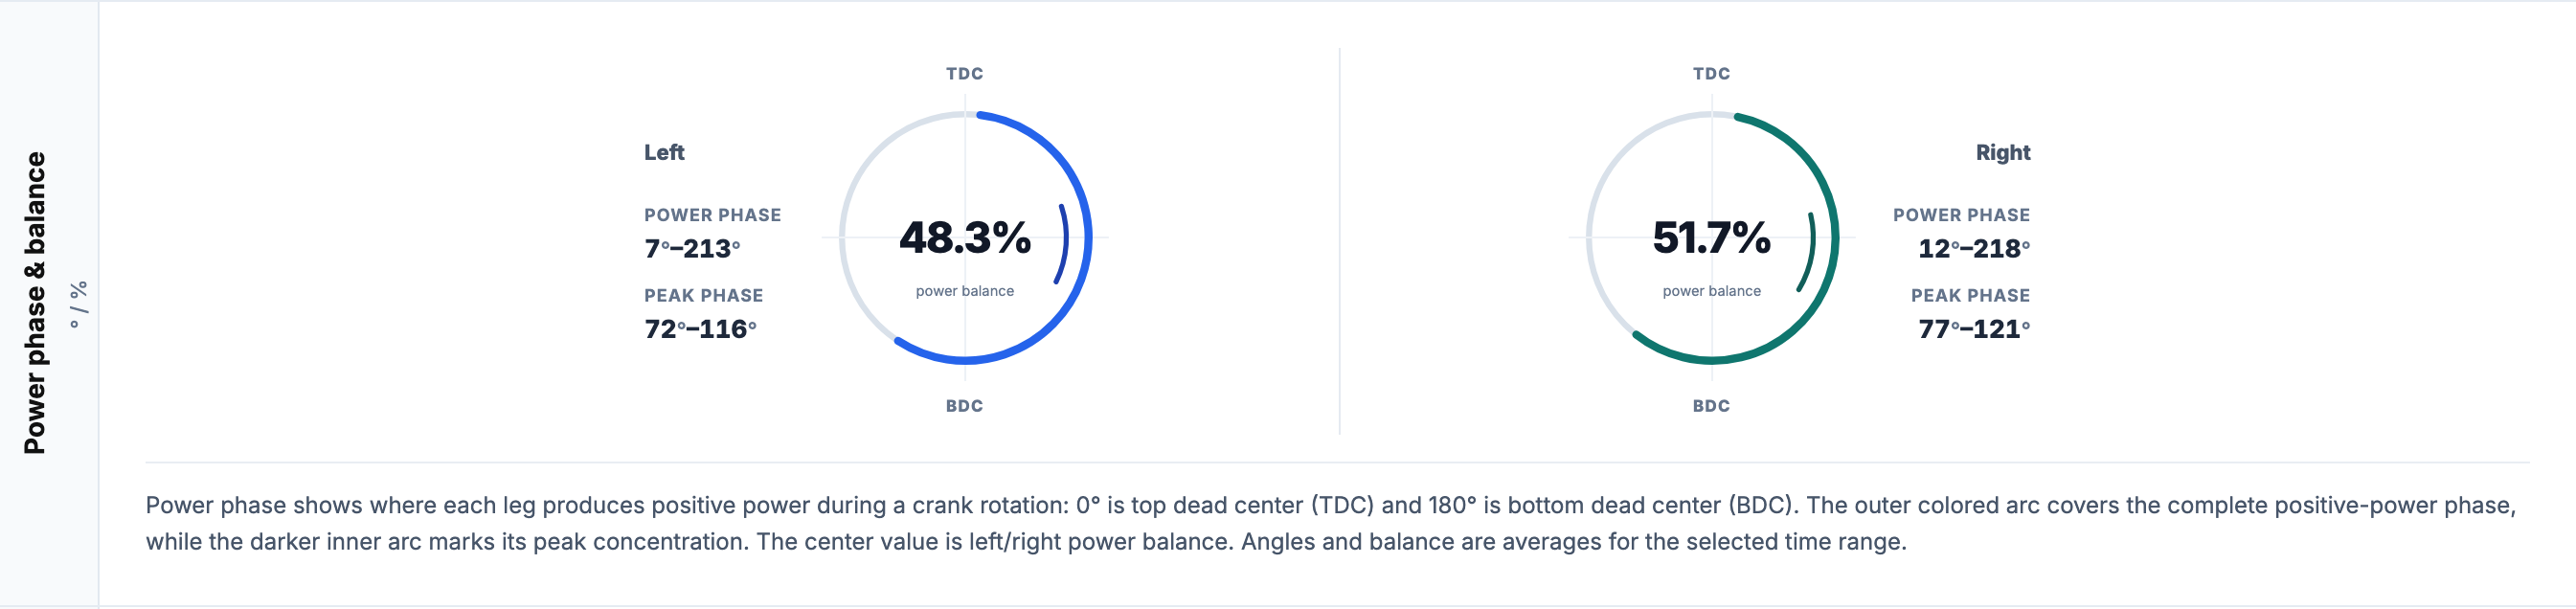
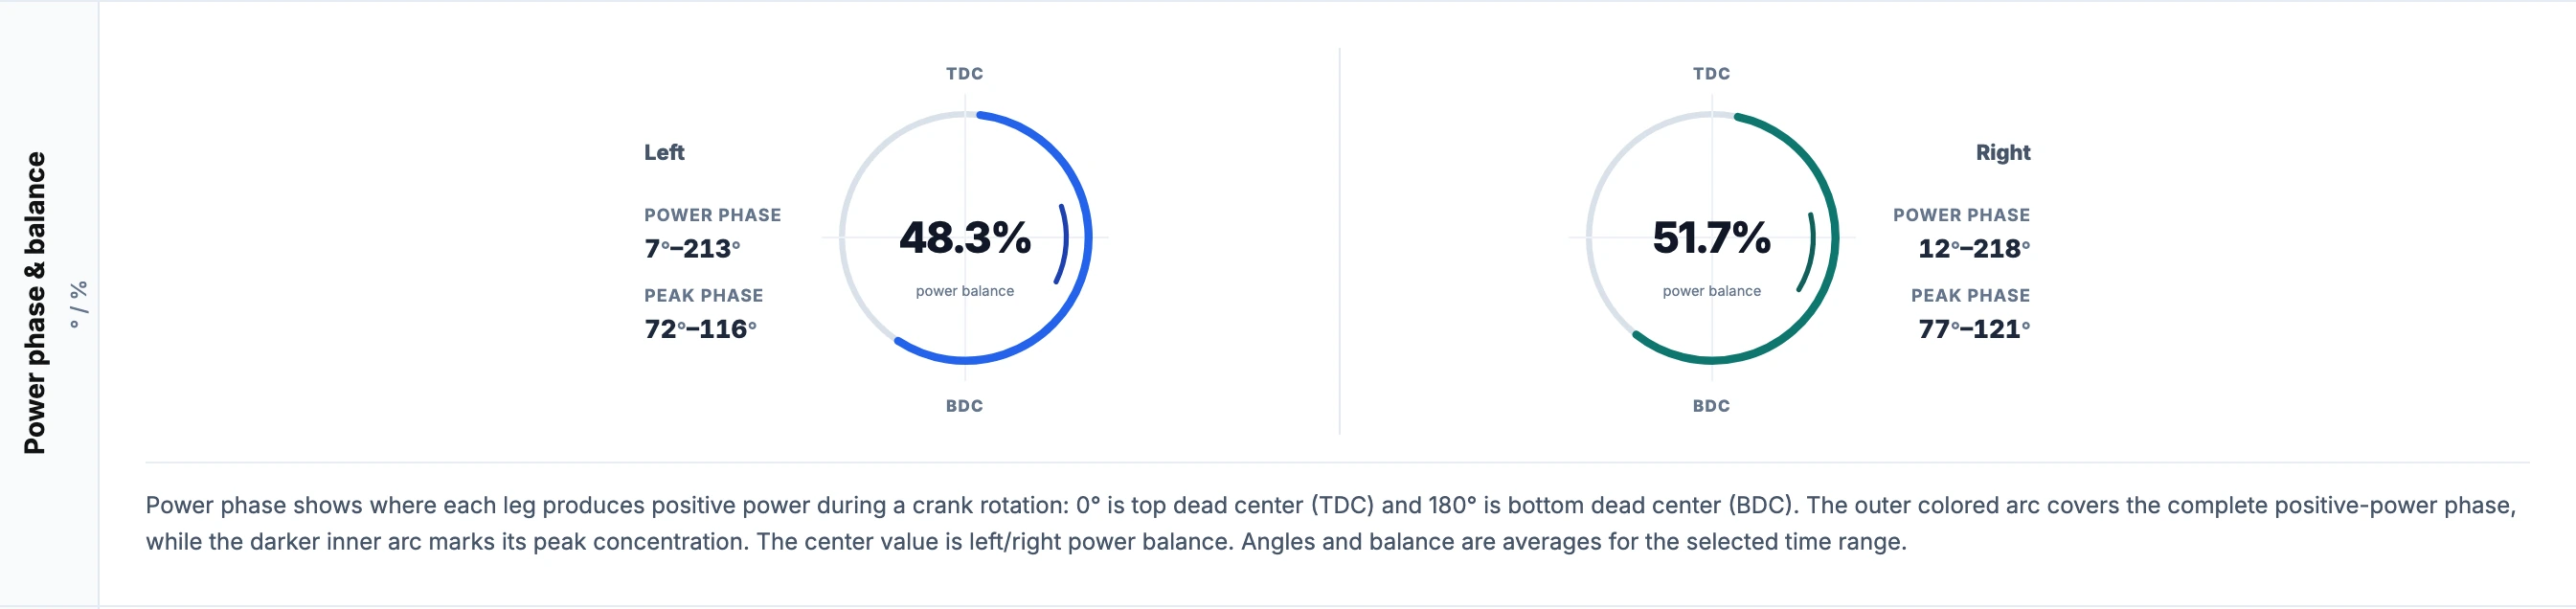
The centre of each dial shows that leg's power balance. The surrounding arcs describe where power was produced during the crank rotation.Enlarge the crank diagrams
Left/right balance: each leg's share of power
The demo averages **48.3% left and 51.7% right**. This describes the split of recorded power between the two sides. It does not mean that the left foot pressed 48.3% of the pedal's width; that is a different measurement, PCO. Garmin's [Cycling Dynamics definitions](https://www8.garmin.com/manuals/webhelp/GUID-E17670DF-416F-455E-8444-29845F375EBD/EN-US/GUID-9519F9B3-0FAC-4B18-B122-48F61CF5831B.html) distinguish power balance from force position on the platform.
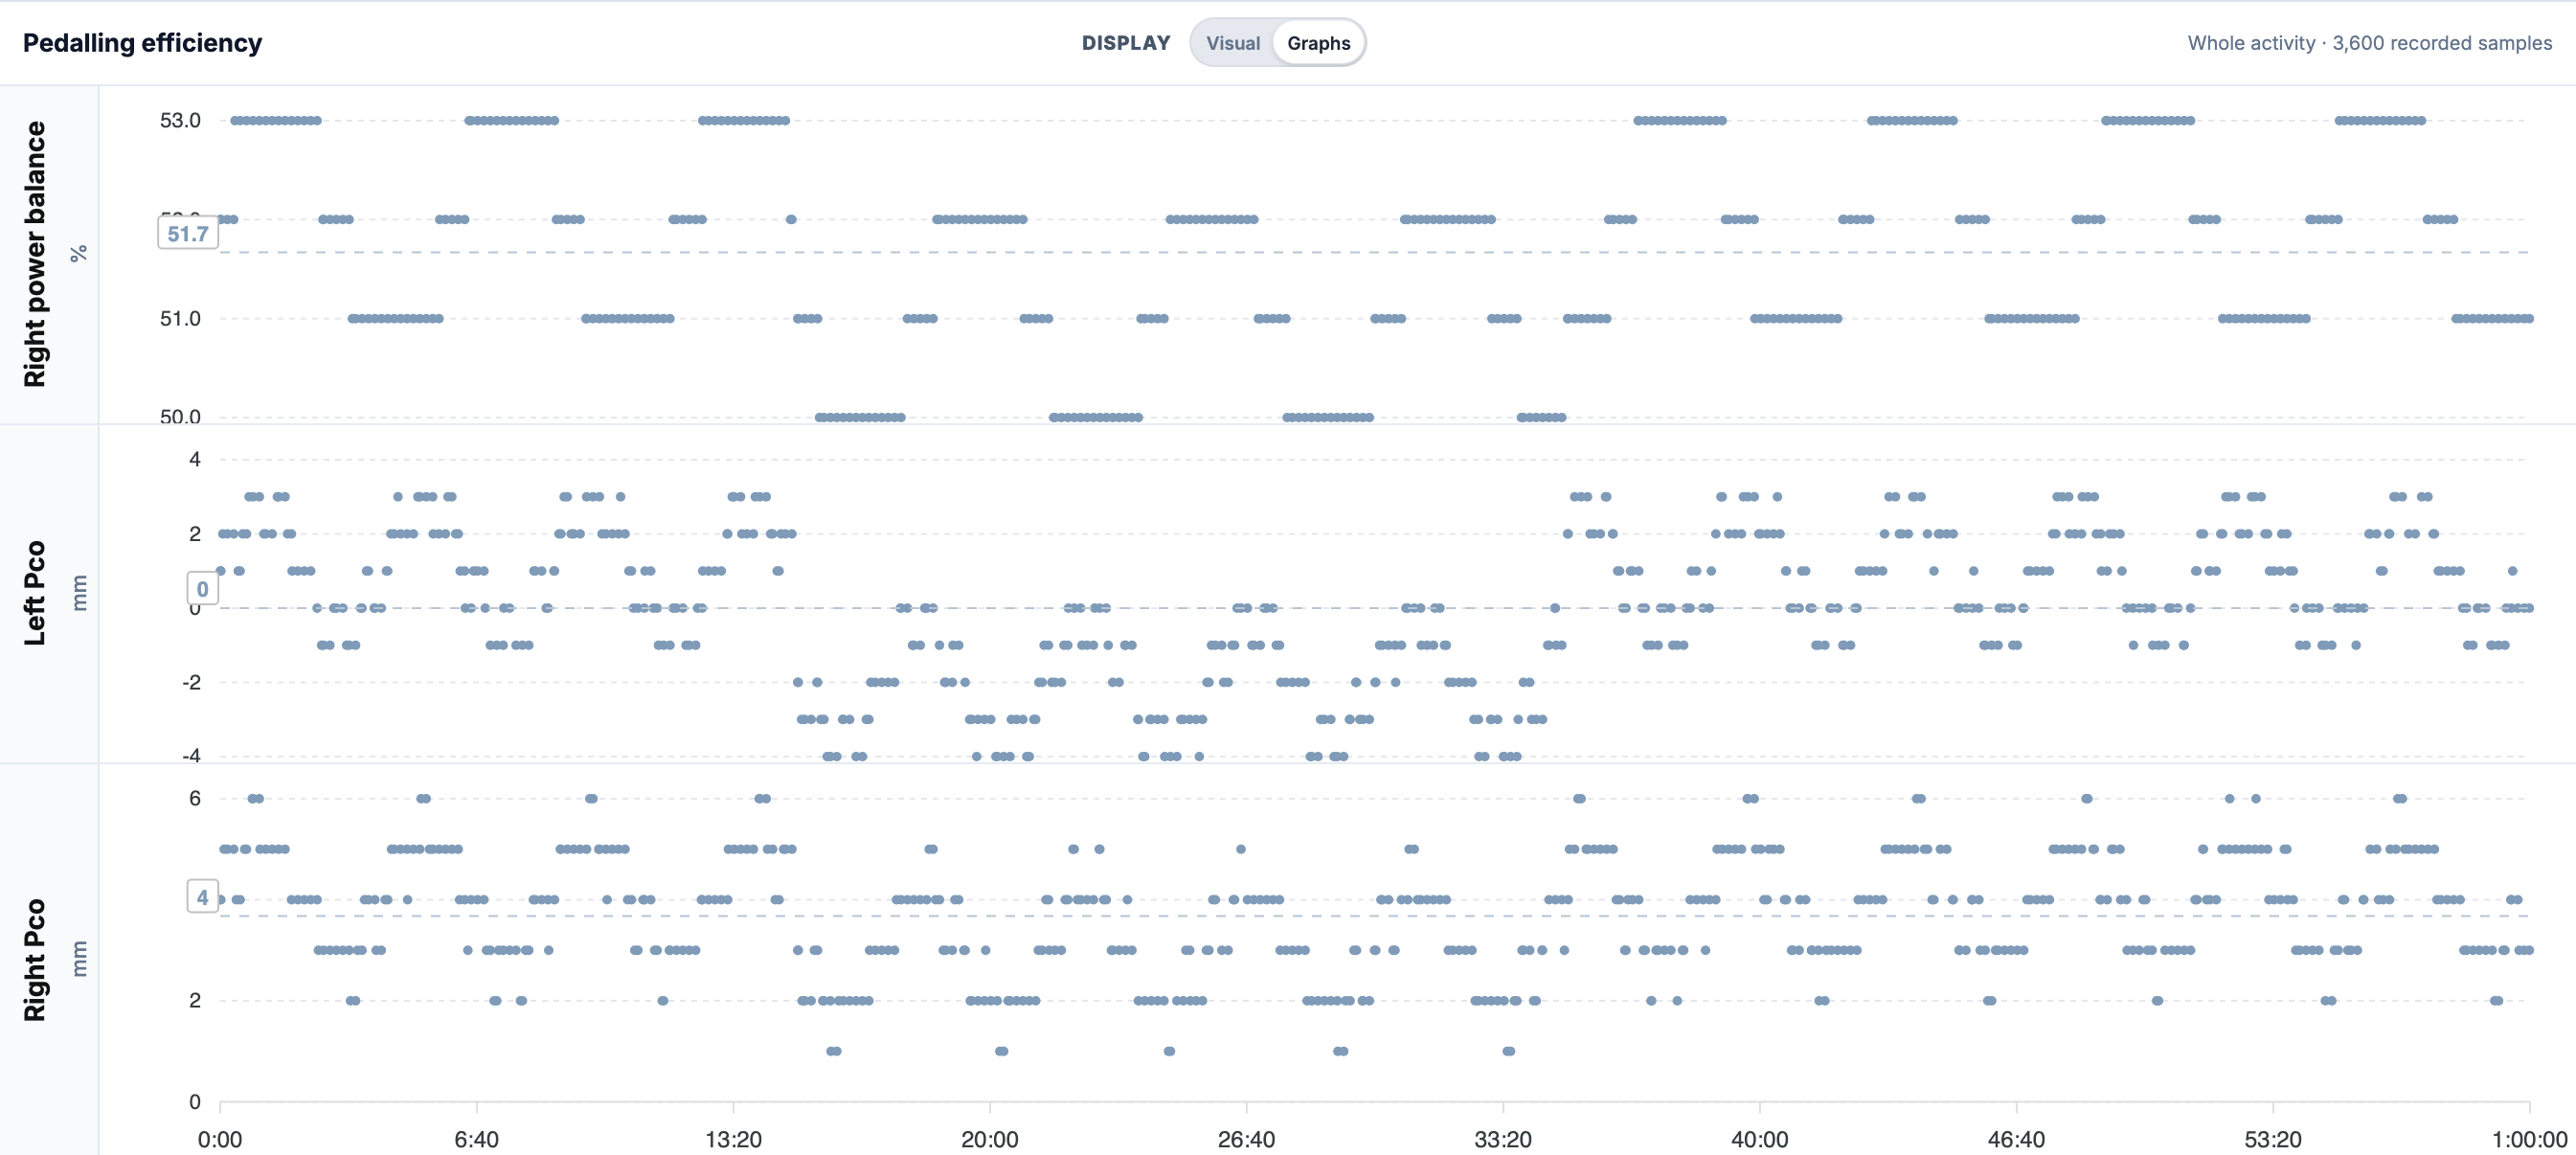
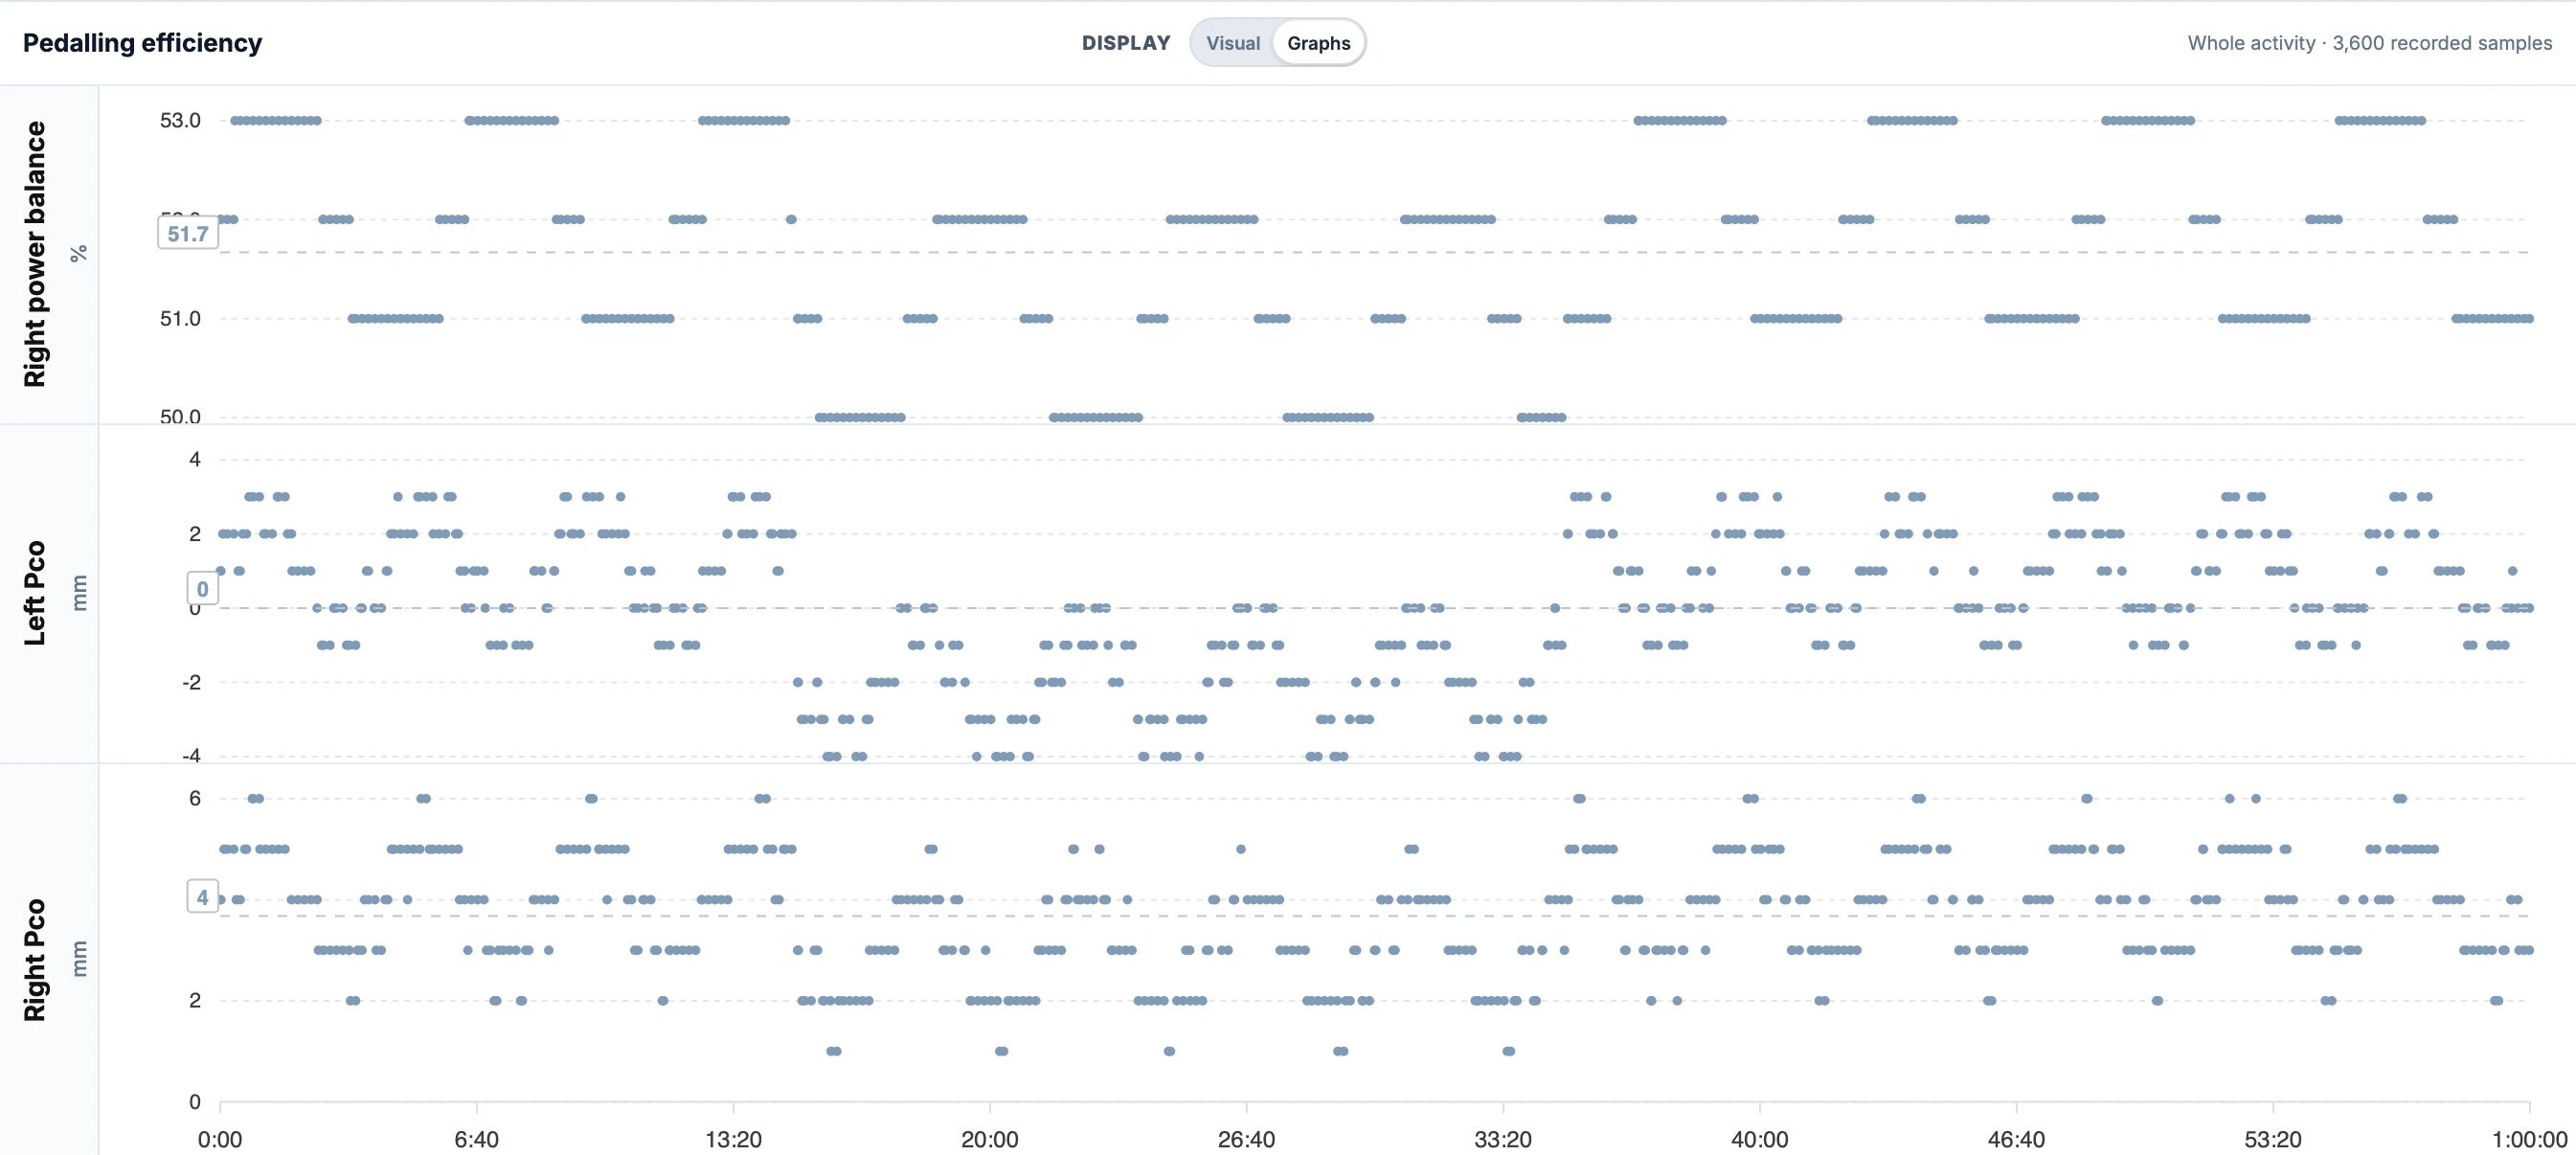
In Graphs, the channel is called **Right power balance**. The corresponding left share is 100 minus the right value. EffortSignal decodes the side recorded in the FIT balance field before presenting this consistent right-side series.
To inspect a change during a ride, compare a steady section with a harder interval at a known cadence. A whole-ride average can hide variation between them. EffortSignal does not grade the split or prescribe a 50/50 target, and total power alone cannot supply measured left/right balance.
Power phase: read the crank angles
The top of each dial is **0°**, top dead centre (**TDC**). The bottom is **180°**, bottom dead centre (**BDC**). The outer coloured arc marks the part of the rotation with positive power. The darker inner arc marks the recorded peak-power phase.
For the demo's left pedal, the positive-power phase runs from **7° to 213°** and the peak phase from **72° to 116°**. The right pedal shows **12° to 218°** and **77° to 121°**. These are average boundary angles for the displayed range. A longer arc means positive power extends through more of the rotation; its length is not a measurement of watts.
Switch to Graphs to inspect the start and end boundaries separately. Each leg can have four traces: power-phase start, power-phase end, peak-phase start and peak-phase end. The visual dial is the compact summary of those channels. Use [Power, Pace & HR Curves](/features/performance-curves/) when the question is how much power you sustained for a duration.
Platform Center Offset: where force lands on each pedal
**Platform Center Offset (PCO)** is measured in millimetres from the pedal platform's centre. A positive value is outward, away from the bike's centreline; a negative value is inward. EffortSignal mirrors the left and right diagrams, so outward is drawn toward the outside of each pedal.
[](/marketing/product/catalog-cycling-pco-desktop.png)
The translucent band is the observed minimum-to-maximum range. The solid marker is the average; the dashed centre marks zero. Both pedals use the same ±10 mm scale here.Enlarge the pedal offset diagrams
The demo's left pedal averages about **0.0 mm**, but individual readings span **−4.0 to +3.0 mm**. A mean near the centre therefore does not imply that every reading was centred. The right pedal averages **+3.7 mm**, with a **+1.0 to +6.0 mm** range.
The shared scale is symmetric around zero. Its extent is at least **±10 mm** and expands in 5 mm steps when the observations need more room. This keeps a small left/right difference from filling the entire diagram simply because the recorded range is narrow.
PCO can document how the readings change between a steady climb and another part of the ride. It does not calculate a cleat adjustment or a bike-fit diagnosis. Keep equipment and riding conditions comparable when reviewing it across sessions.
Torque effectiveness and pedal smoothness
**Stroke quality** places the two metrics side by side, with a separate bar for each leg. Here, torque effectiveness averages **79.3% left / 82.0% right**, while pedal smoothness averages **25.0% / 26.7%**. EffortSignal averages the sensor's recorded percentages; it does not reconstruct the force profile of every revolution from the ordinary power stream.
[](/marketing/product/catalog-cycling-stroke-desktop.png)
Each pair compares the same metric between legs. The two metrics have different definitions, so their percentages should not be compared as equivalent scores.Enlarge the stroke-quality metrics
Torque effectiveness describes how much of the positive contribution remains after opposing torque is accounted for. In the ANT+ definition, P+ is the positive contribution over a revolution and P− is the negative contribution, expressed as a negative number:
```text
Torque effectiveness = 100 × (P+ + P−) / P+
```
If the positive contribution is 100 units and the negative contribution is −20, the result is **80%**. This describes the crank's mechanical signal, not the fraction of food energy converted into motion.
Pedal smoothness compares average power with peak power within one crank cycle:
```text
Pedal smoothness = 100 × average power / peak power
```
A 100 W average and 400 W peak gives **25%**. The shape depends on riding style and whether the sensor reports each leg or the combined system. The [ANT+ Bicycle Power profile, sections 12.2–12.3](https://forums.garmin.com/cfs-file/__key/communityserver-discussions-components-files/402/D00001086_5F00_ANT_2B005F00_Device_5F00_Profile_5F002D005F00_Bicycle_5F00_Power_5F00_Rev_5F00_5.1.pdf) defines both calculations.
There is no target band in these bars. Compare the same metric under similar power, cadence and equipment conditions. [Efficiency Factor](/features/efficiency-factor/) answers a different question: Weighted Power divided by average heart rate. The shared word “efficiency” does not make those measurements interchangeable.
Choose the graphs you want to inspect
Select **Graphs** to replace the visual summaries with recorded traces. Open **Settings** below the chart panel, tick the channels you need, and choose **Save layout**. Drag the handles or use the arrow buttons to change their order. The saved arrangement applies to this tab across your cycling activities. **Cancel** leaves the saved layout unchanged.
[](/marketing/product/catalog-cycling-graphs-desktop.png)
This saved layout keeps Right power balance and both PCO channels visible. Each row has its own units and vertical scale; the elapsed-time axis is shared.Enlarge the recorded dynamics graphs
PCO readings appear as points, which makes their integer-millimetre steps visible. A dashed horizontal reference shows the average of the plotted points. Hover over the graph to inspect values at the shared cursor time. Use the full Visual summary for the average across all available records in the range: the plotted series may have been reduced for display.
**Pan** moves the visible time range; **Zoom** selects a shorter range by dragging across a graph. The [Activity Analysis guide](/features/activity-analysis/) covers the shared navigator and chart controls. For an interval you want to keep, [Interval Analysis](/features/interval-analysis/) explains how to name it and set its boundaries.
Zoom into one part of the climb
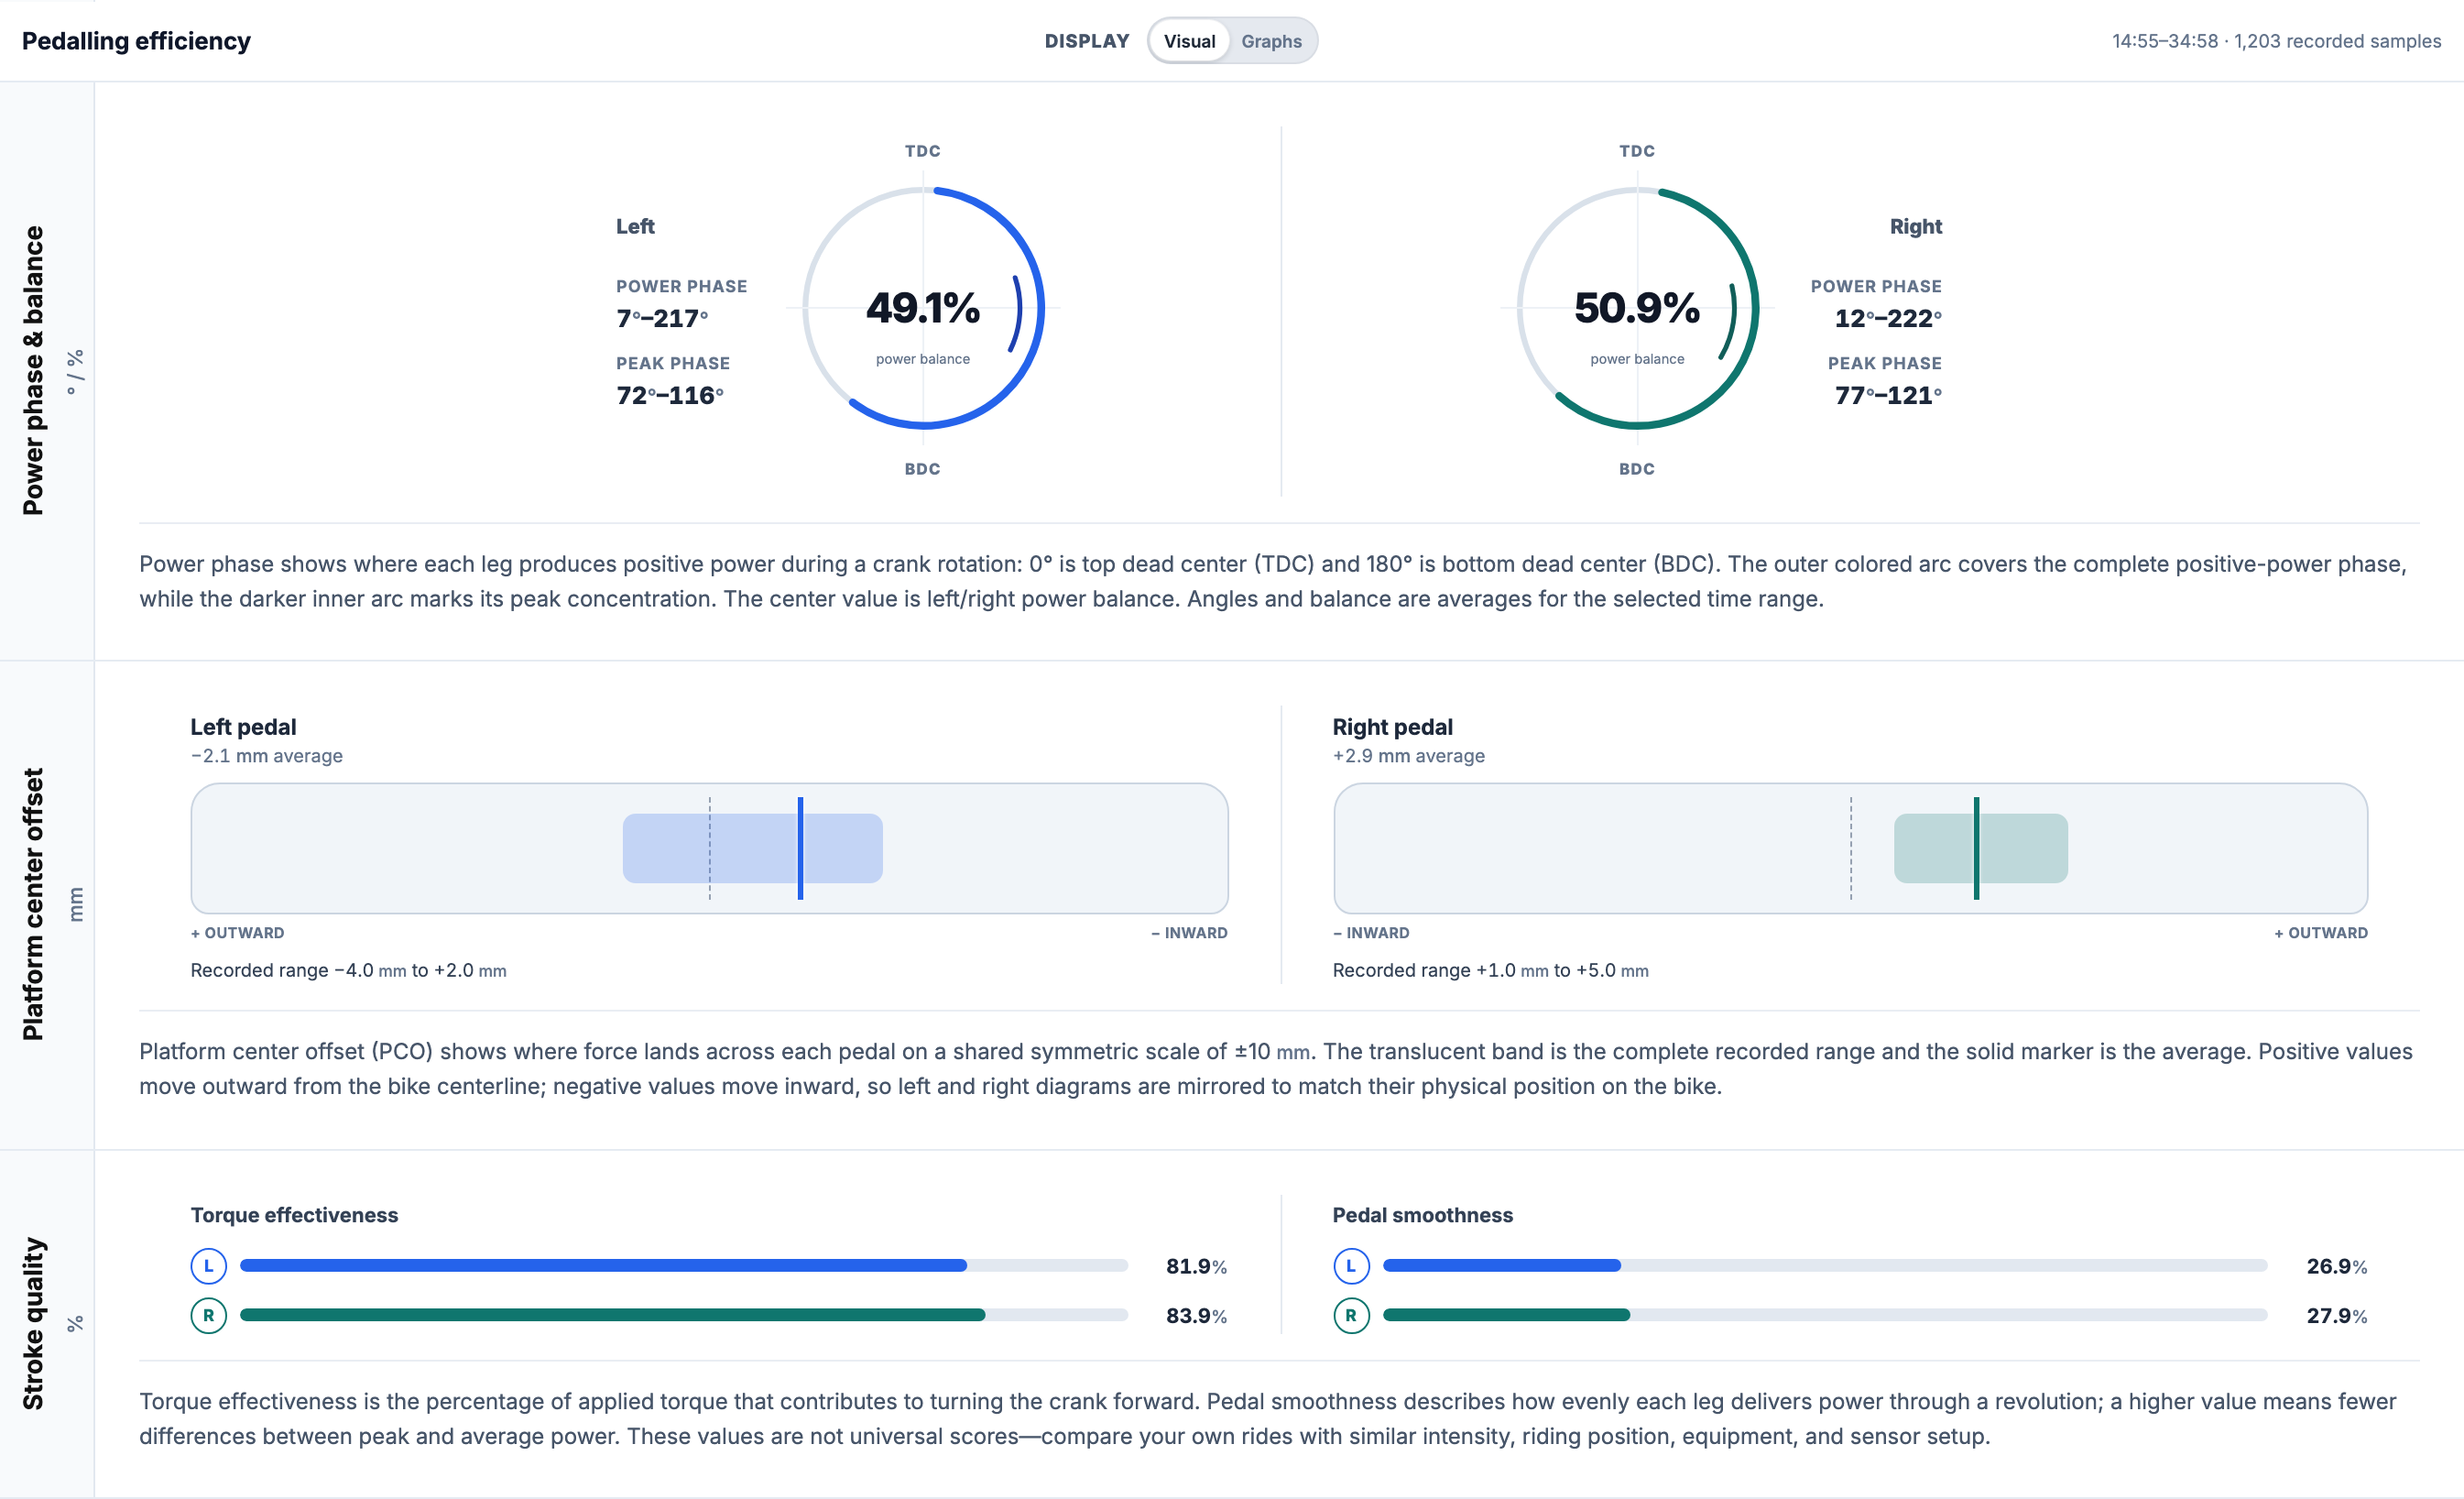
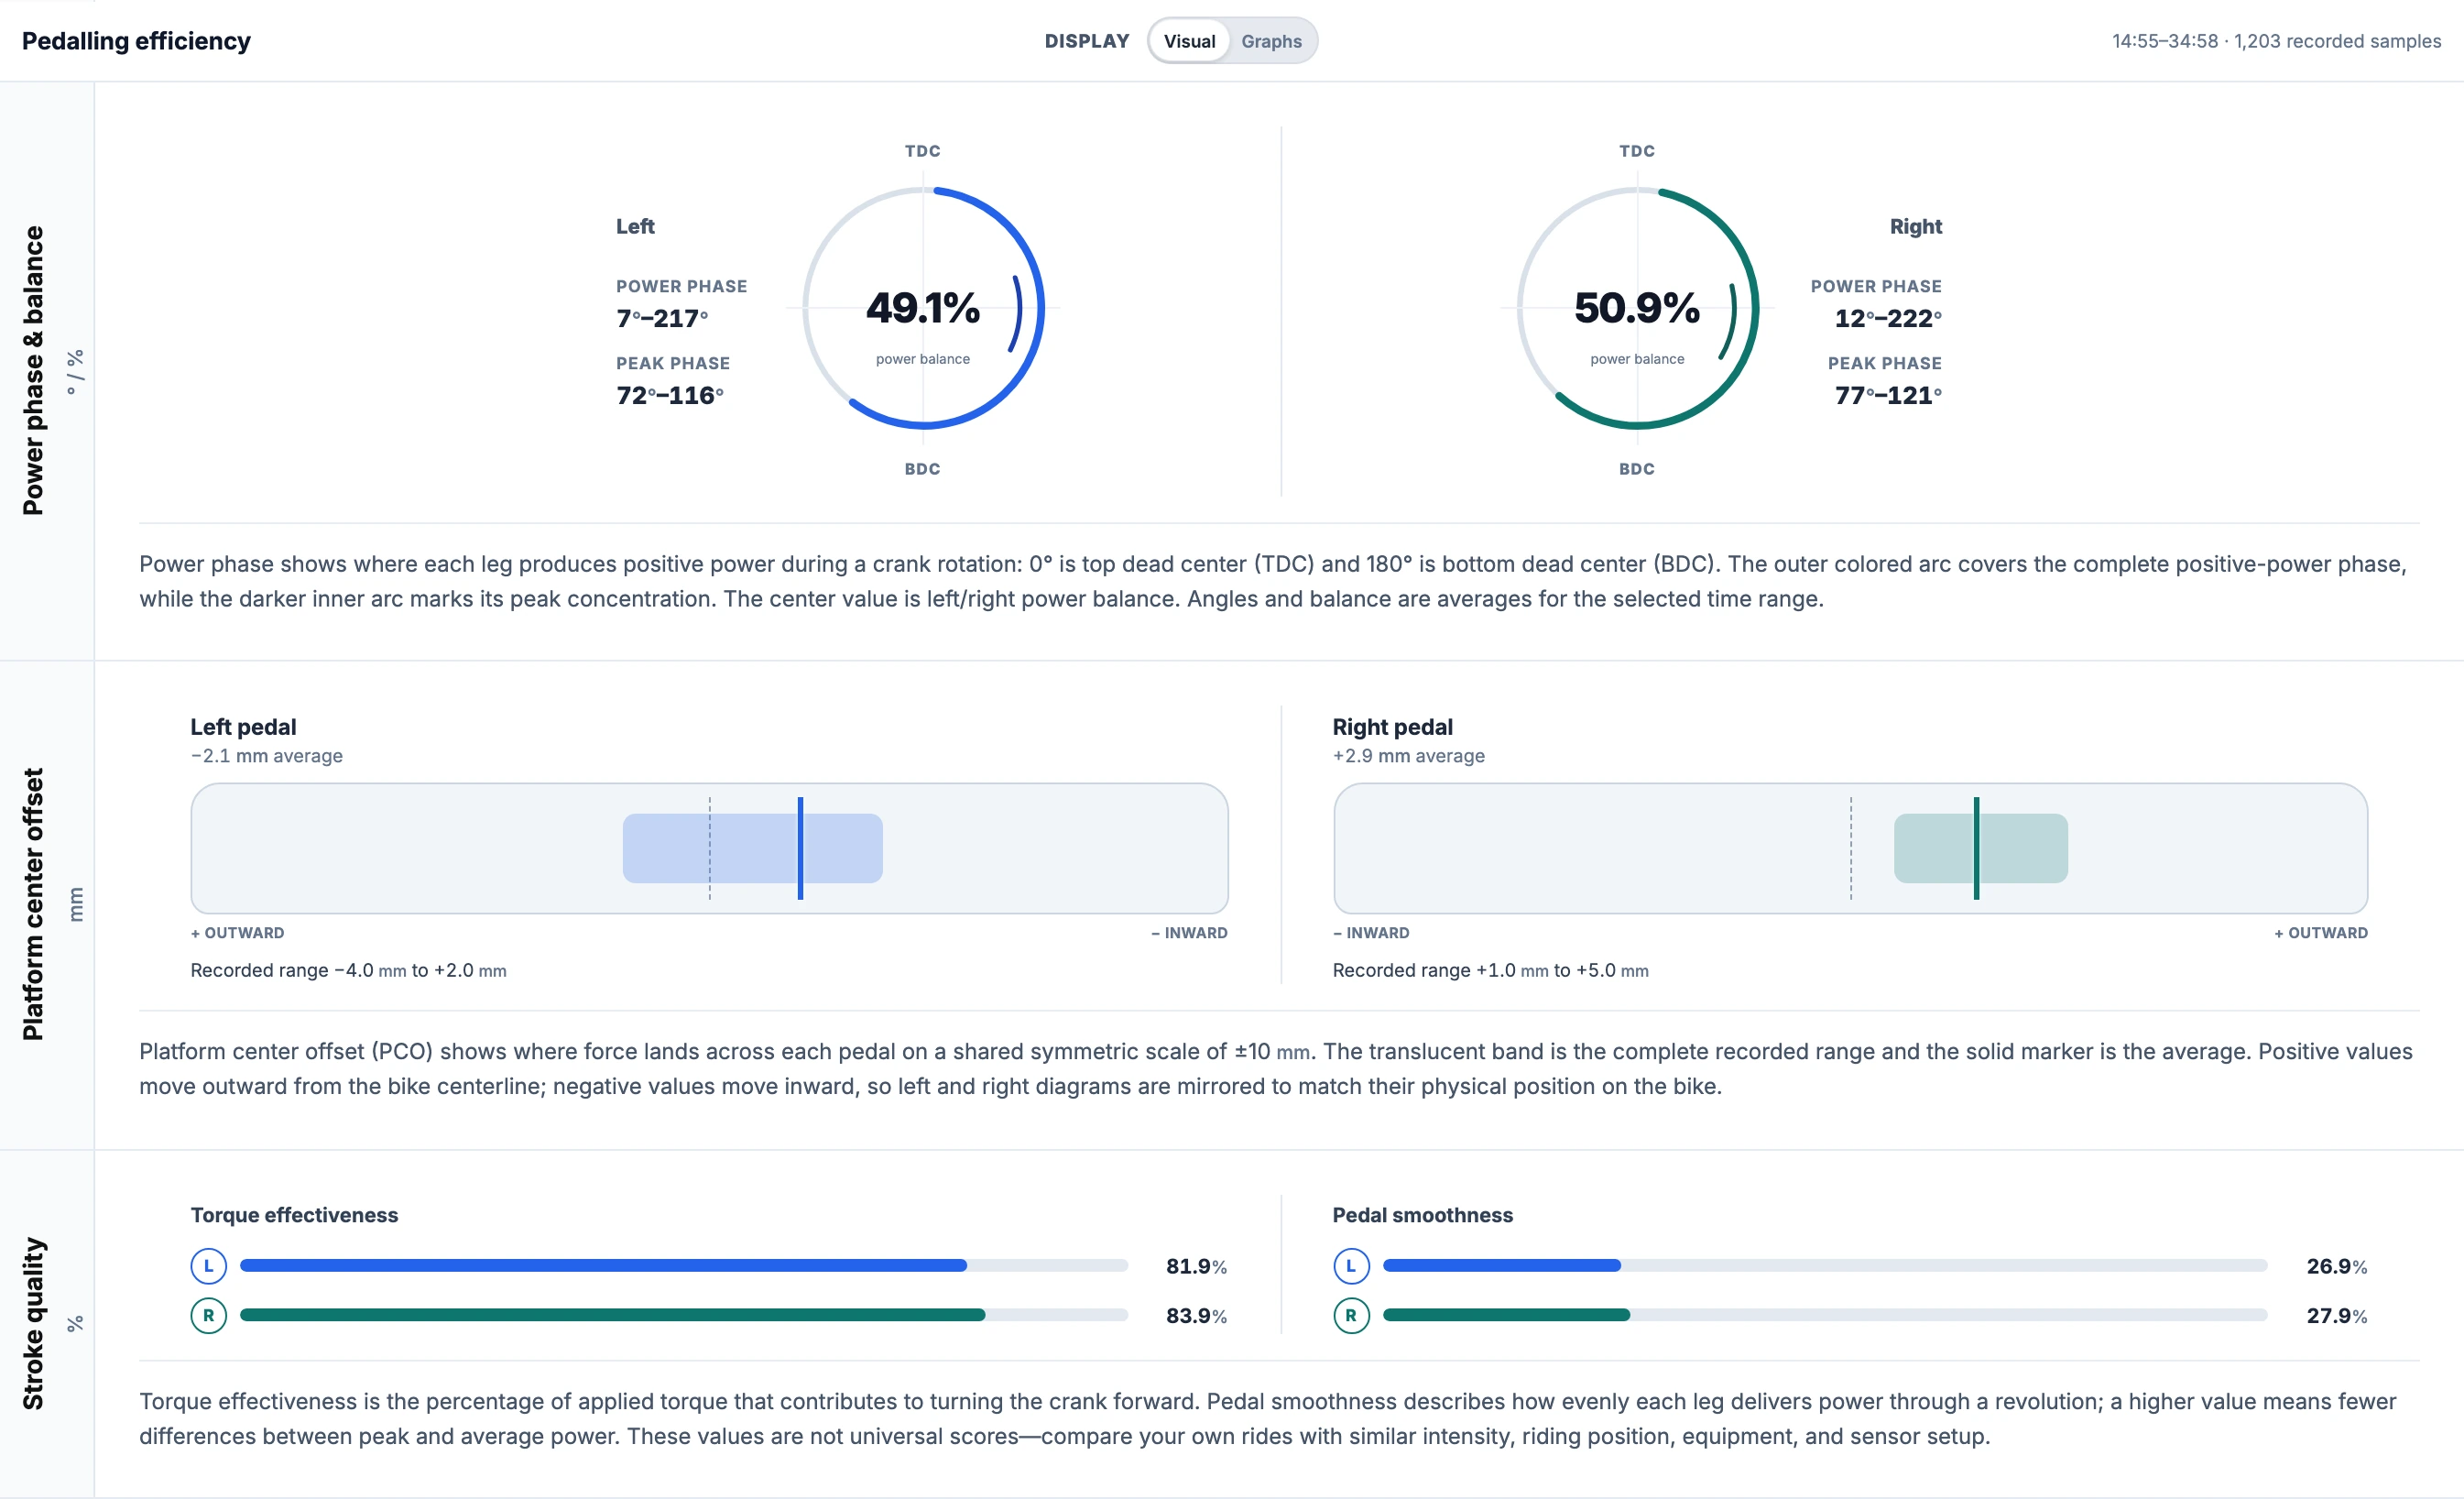
The middle of the demo contains roughly 20 minutes at **263 W**, surrounded by riding around **212 W**. Selecting that section changes which records contribute to the visual summary. Switch back to **Visual** and check the time range in its header before comparing numbers.
[](/marketing/product/catalog-cycling-range-desktop.png)
The native Zoom selection covers approximately 15–35 minutes. The header shows its actual boundaries and sample count. Desktop and phone selections can differ by a few seconds.Enlarge the selected-range summary
Here, balance moves to roughly **49% left / 51% right** and average left PCO moves inward to about **−2 mm**. The screenshot demonstrates how selecting a range changes the calculation. Its synthetic data does not establish that a particular power or riding position causes those changes.
What about riding seated and standing?
Compatible Garmin cycling-dynamics systems can record seated/standing position. This can distinguish climbing in the saddle from an out-of-saddle effort. Garmin lists it as a separate measurement in its [Rally Cycling Dynamics manual](https://www8.garmin.com/manuals/webhelp/GUID-E17670DF-416F-455E-8444-29845F375EBD/EN-US/GUID-9519F9B3-0FAC-4B18-B122-48F61CF5831B.html).
**EffortSignal currently has no seated/standing timeline, position totals or automatic comparison between the two positions.** The pedal-offset diagrams do not identify whether you were sitting or standing, and a change in cadence is not used to infer it.
If you know when you stood up during a ride, you can mark that section as a manual interval and inspect its recorded power and pedal metrics. The position label then comes from you. It is not automatic detection of a rider-position event.
Performance Condition: a recorded Garmin estimate
Performance Condition is Garmin's estimate of how current performance compares with the athlete's usual fitness. For cycling, Garmin describes an assessment using **power, heart rate and HRV**, with an initial value during the first **6–20 minutes**. The number represents a deviation from the device's baseline VO₂ max estimate. [Garmin: What is Performance Condition?](https://support.garmin.com/en-IE/?faq=A28UA4k16v1qjjGuvSFgo8)
EffortSignal can display a chart named **Performance condition (field 90)** in the Performance tab. The field number is intentional: this is a **provisional interpretation of a private Garmin FIT field**, so its meaning should be checked against the source device's report. EffortSignal does not calculate Garmin Performance Condition from power or HRV, and this chart should not be treated as a verified Garmin score for every recording.
[](/marketing/product/catalog-cycling-condition-desktop.png)
The demo field begins at +4 and later reaches −2. The blank first eight minutes contain no value. This illustrates the renderer and its sign convention, not a validated physiological assessment.Enlarge the Performance Condition chart
Above-zero values are green; below-zero values are red. A bold line marks zero and the vertical scale is symmetric. A falling field value alone does not identify a cause. Check the recording's power and heart-rate context, and verify the field's interpretation before drawing a training conclusion.
This field is separate from EffortSignal's [eFTP](/features/eftp/), [aerobic decoupling](/features/aerobic-decoupling/) and [TSB / Form](/features/tsb/). Each has its own inputs and calculation.
How the visual summaries are calculated
The summaries use available finite observations within the selected elapsed-time range, before the graph's point limit is applied. Missing channels remain unavailable. A partially recorded pedal is not completed by copying the other side's readings.
| Measurement | Summary shown in Visual |
| --- | --- |
| Left/right balance | Arithmetic mean of decoded right-side percentages; left is 100 minus right |
| PCO, per pedal | Minimum, arithmetic mean and maximum recorded offset |
| Torque effectiveness / pedal smoothness | Arithmetic mean of each available side's recorded percentages |
| Power-phase boundaries | Circular mean for each start and end angle, separately |
These are **sample averages**, not averages weighted by power or the time between records. The range band's endpoints are the observed minimum and maximum, not a confidence interval.
Angles need a circular mean because the crank wraps at 360°. Averaging **350° and 10°** should point to **0°**, not halfway around at 180°. EffortSignal averages the sine and cosine components, then converts the result back to degrees. If there is no meaningful mean direction, that boundary remains unavailable.
Why a metric may be missing
The pedal system must measure the channel, the recording device must receive it, and the imported recording must contain usable data. A ride with watts and heart rate does not necessarily contain PCO, phase angles or separate left/right measurements. EffortSignal shows the channels it can read; an absent specialist metric is not a zero reading.
The screenshots use the same native analysis components as ordinary rides, with 3,600 synthetic stream records stored in an isolated demo. Interface behaviour and summary calculations were checked against EffortSignal **0.1.25** on **September 14, 2026**. Garmin and ANT+ sources above explain the sensor definitions; the controls, averaging rules and availability statements describe the current EffortSignal implementation.
All Pro features are free through January 31, 2027. No credit card or automatic charges. After Early Access, keep using Free or choose Pro. [See Free and Pro plans](/pricing/).