# ACWR (Acute:Chronic Workload Ratio)
Canonical HTML: https://effortsignal.com/features/acwr/
Last content update: 2026-09-14
Workload ratio puts recent recorded training beside your longer history. EffortSignal calculates it as ATL / CTL and shows it in Dashboard and Calendar's Week Details. A value of 1.39 means the short-term load estimate is 39% above the longer-term estimate. Open the week behind it to see which sessions contributed.
Screenshots use synthetic French and Swiss training examples in the web app. The worked week is 24–30 August 2026. Training load, fitness, fatigue and form are included in Free and Pro.
Start with Training Load in Dashboard
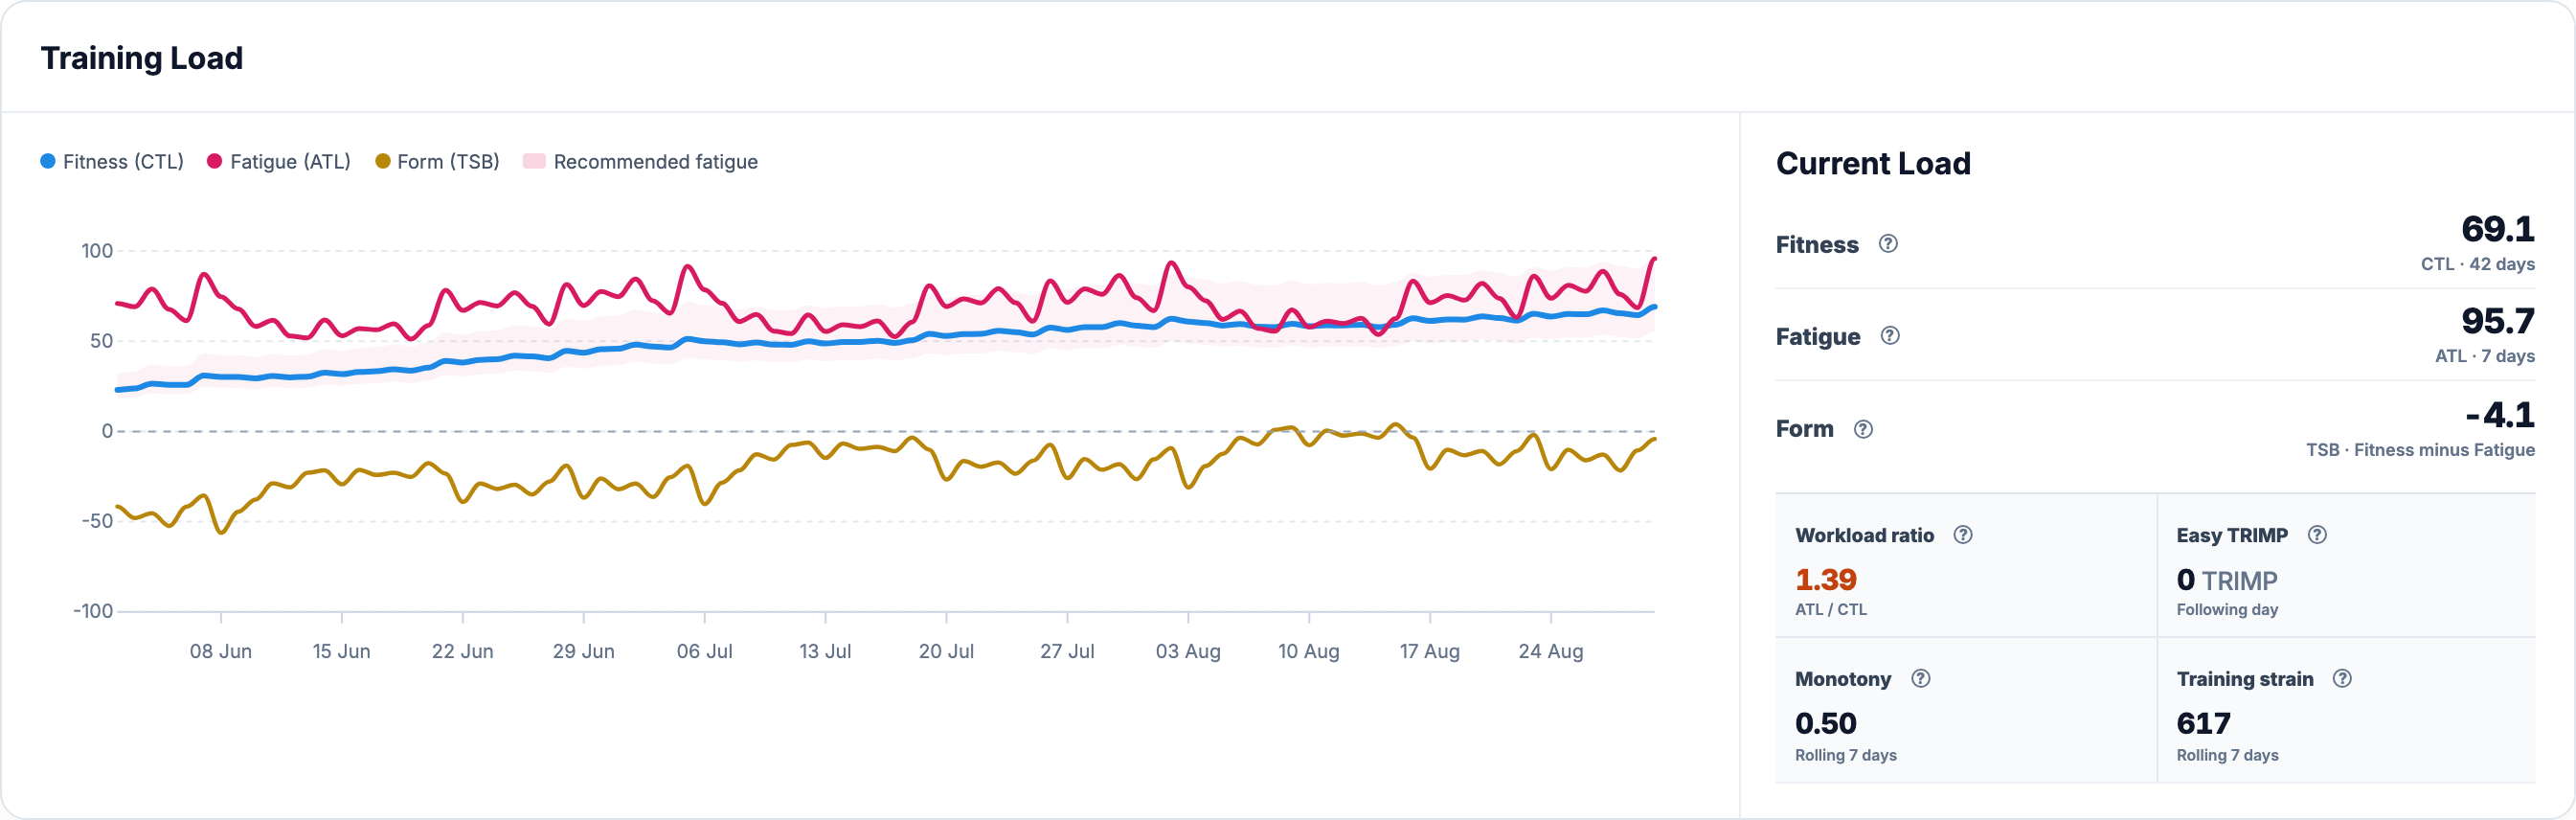
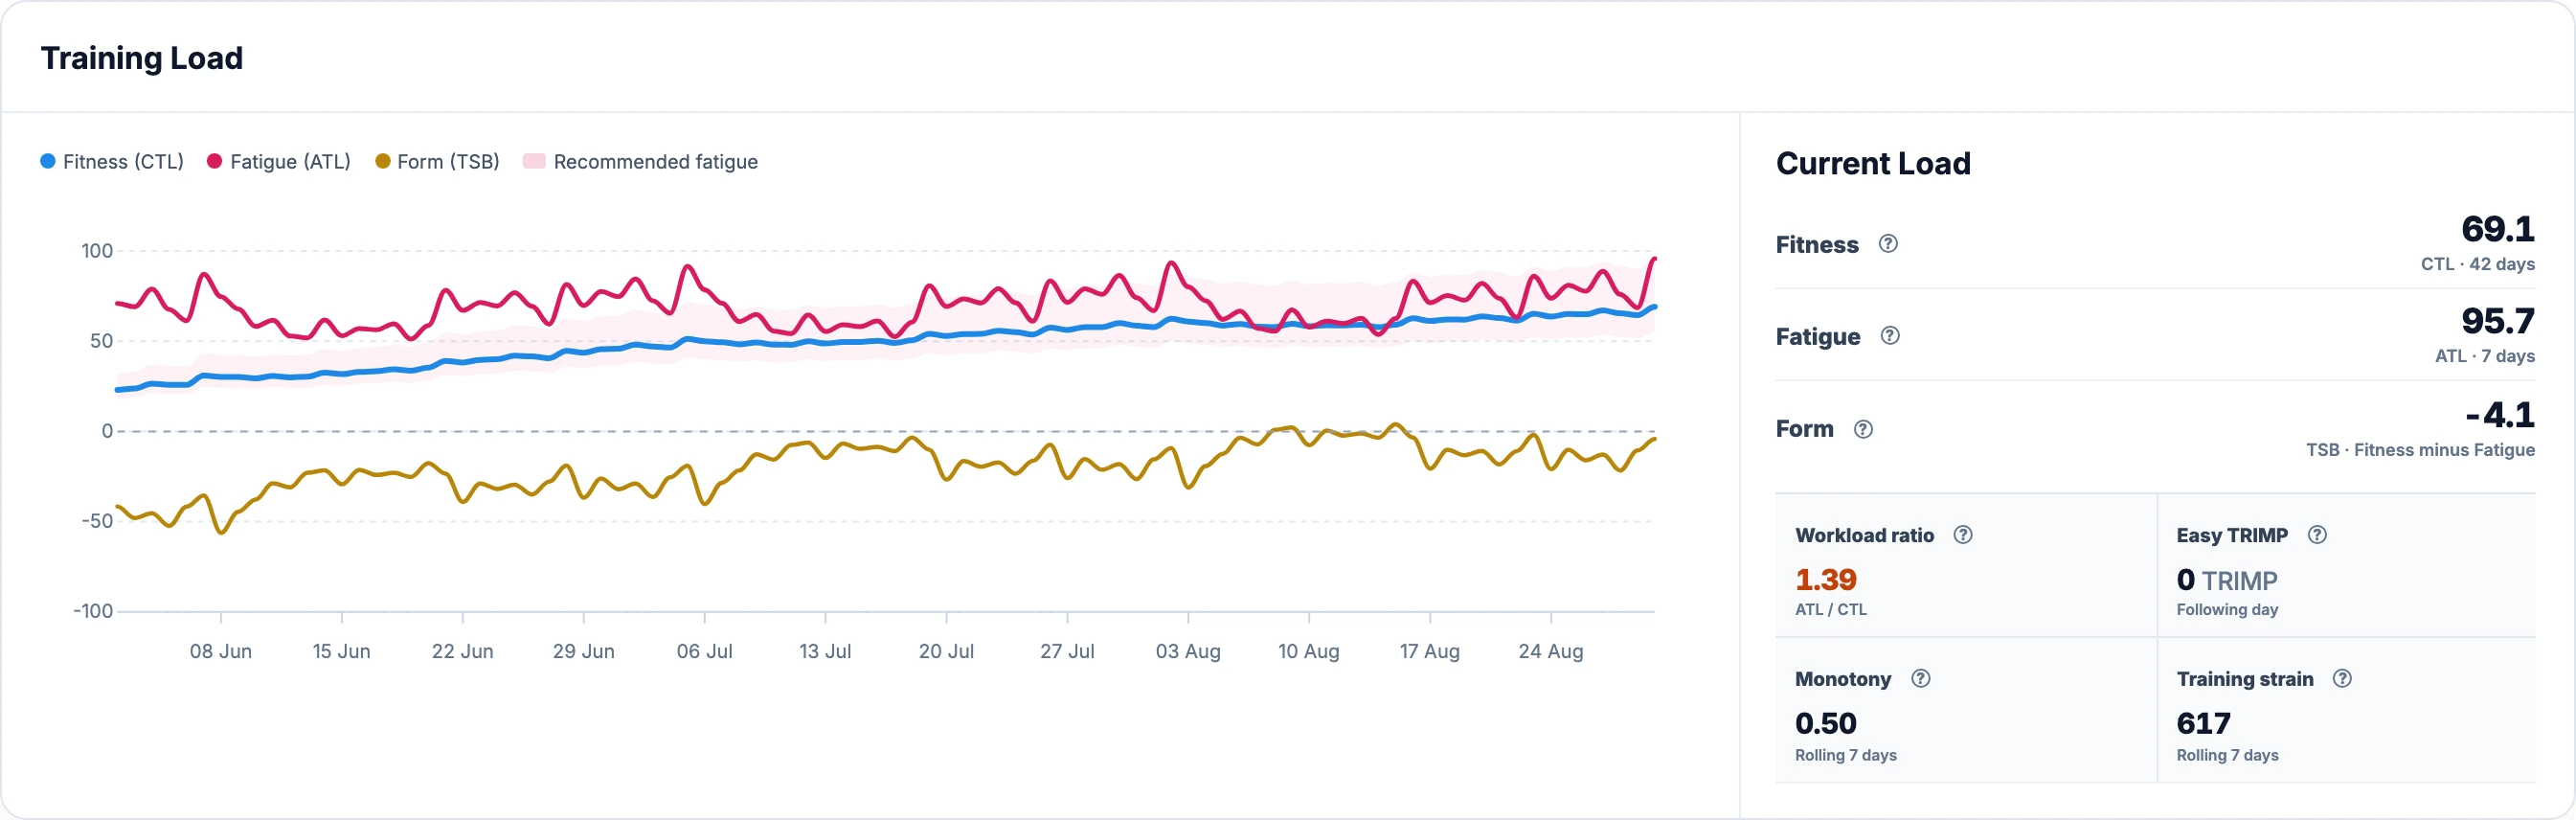
Open **Dashboard** and scroll to **Training analytics → Training Load**. On desktop, the graph is on the left and **Current Load** on the right. On a phone, the numbers follow the graph. **Fitness** is CTL, **Fatigue** is ATL, and **Form** is TSB. **Workload ratio** appears beneath these three values, with **ATL / CTL** printed below it.
Use the date control beside Dashboard's title to inspect a historical endpoint. **Today** returns to the present. **42D, 3M, 6M, 1Y and 2Y** change how much history the charts display. They do not change the seven- and 42-day smoothing used to calculate ATL and CTL.
[](/marketing/product/catalog-acwr-dashboard-desktop.png)
As of 30 August: ATL is 95.7083 and CTL is 69.0884 before rounding. Dividing them gives 1.3853, displayed as 1.39. The graph shows three months of the same training history.Enlarge the Dashboard workload example
The graph draws Fitness in blue, Fatigue in pink and Form in ochre. Hover over a measured line, or touch it on a phone, to inspect the date and available values together. The summary remains tied to the selected endpoint. There is no separate ACWR line here: the ratio describes the relationship between ATL and CTL on that date.
How EffortSignal calculates ACWR
The input is **daily TRIMP**, summed from recorded activities starting on each local calendar day. [TRIMP](/learn/trimp/) estimates cardiovascular training load from duration, heart rate and the applicable athlete settings. Cycling, running and other sports can contribute when their HR data supports the calculation. PSS remains a separate power-load metric; it does not replace missing TRIMP in this history.
For a day called d, the recurrence is:
```text
ATL[d] = ATL[d−1] + (TRIMP[d] − ATL[d−1]) / 7
CTL[d] = CTL[d−1] + (TRIMP[d] − CTL[d−1]) / 42
Workload ratio[d] = ATL[d] / CTL[d]
```
These are exponentially weighted estimates. Recent days contribute more, and older days fade gradually. A seven-day ATL does not discard everything older than a week. Both estimates include the selected day's load, so this is a **coupled** ratio. It is also different from dividing one week's total by a four-week rolling average—another calculation commonly called ACWR.
The ratio has no units. **ATL 60 / CTL 50 = 1.20**; **ATL 12 / CTL 10** also gives 1.20. The proportional change is the same, but the absolute load is very different. That is why the app keeps both values beside the ratio.
Read the bands and the shaded range separately
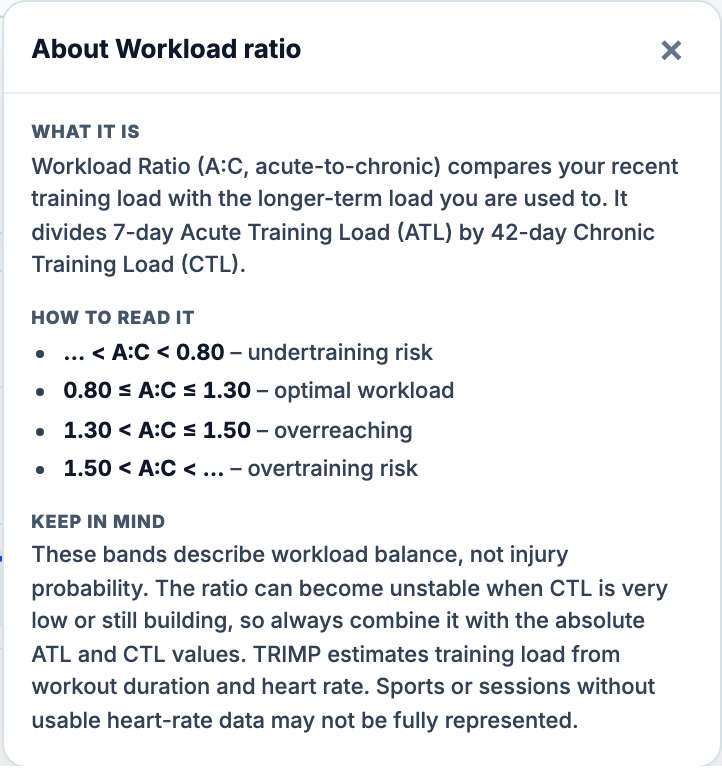
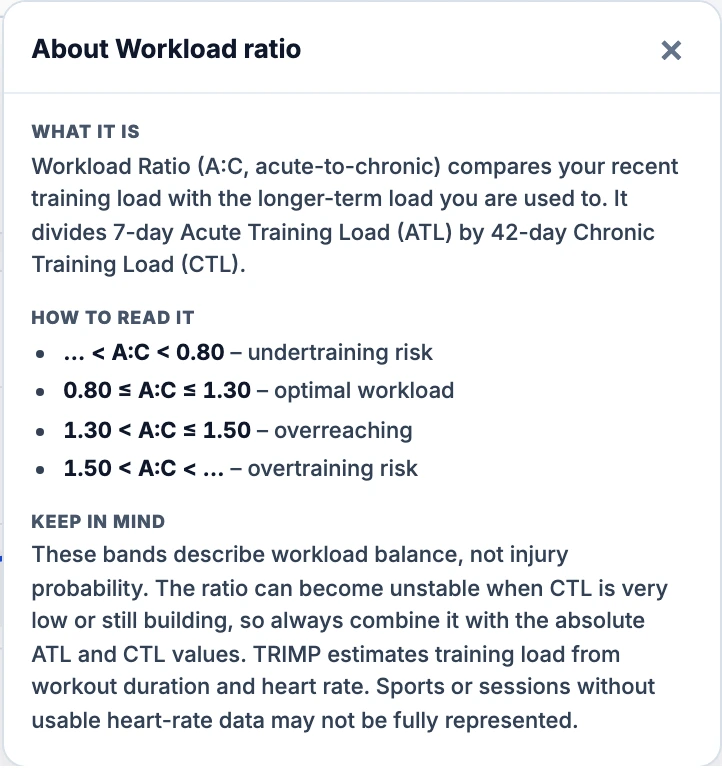
Click the **circled ? beside Workload ratio** to open its explanation. The panel lists the current boundaries, the formula's meaning and the missing-HR limitation. Close it with × or Escape.
[](/marketing/product/catalog-acwr-help-desktop.png)
The help panel reproduces the application's labels. They classify the ratio; they do not establish an athlete's recovery state or injury probability.Enlarge Workload ratio help
| Ratio | Current app label |
| --- | --- |
| Below 0.80 | Undertraining risk |
| 0.80 through 1.30, inclusive | Optimal workload |
| Above 1.30 through 1.50, inclusive | Overreaching |
| Above 1.50 | Overtraining risk |
Treat these as interface labels for relative load. A planned recovery week can sit below 0.80. An **Overreaching** label does not diagnose functional overreaching, and **Overtraining risk** does not diagnose overtraining syndrome. The ratio alone cannot establish those conditions. Research has identified substantial conceptual and statistical problems with using ACWR to prescribe changes intended to prevent injury. [Impellizzeri and colleagues, 2020](https://pubmed.ncbi.nlm.nih.gov/32502973/)
The graph's pink **Recommended fatigue** band is a different rule: **0.8–1.4 × CTL**, available after at least **14 days of history** with positive CTL. At CTL 50, its bounds are 40–70. The ratio's middle band ends at **1.30**, not 1.40. In the screenshot, ATL 95.7 fits inside the 55.3–96.7 shaded range while ratio 1.39 receives the Overreaching label. Both displays follow their respective rules.
Find the sessions behind the end-of-week number
In **Calendar**, browse to the same dates. Each desktop week is a row of dated days with its own summary. The summary shows completed duration and, when history is available, **CTL** and **TSB**. It does not display ACWR directly. Select the summary's evidence area to open **Week Details**. On phones, use the week navigation and the visible week-details control.
[](/marketing/product/catalog-acwr-calendar-desktop.png)
The week contains 9h 05m across five activities. Sunday's long ride follows a short recovery spin on Saturday. The mobile image shows the summary and the first two days.Enlarge the training week in Calendar
The cards show the recorded sessions and their available TRIMP and PSS. A long low-intensity ride can contribute considerable TRIMP through its duration. A planned workout is still a plan: moving it to another day does not change completed ATL or CTL. Planned PSS and completed TRIMP describe different inputs. The [Training Calendar guide](/features/training-calendar/#plan-and-actual) explains the plan and actual views.
Read values, changes and the daily shape
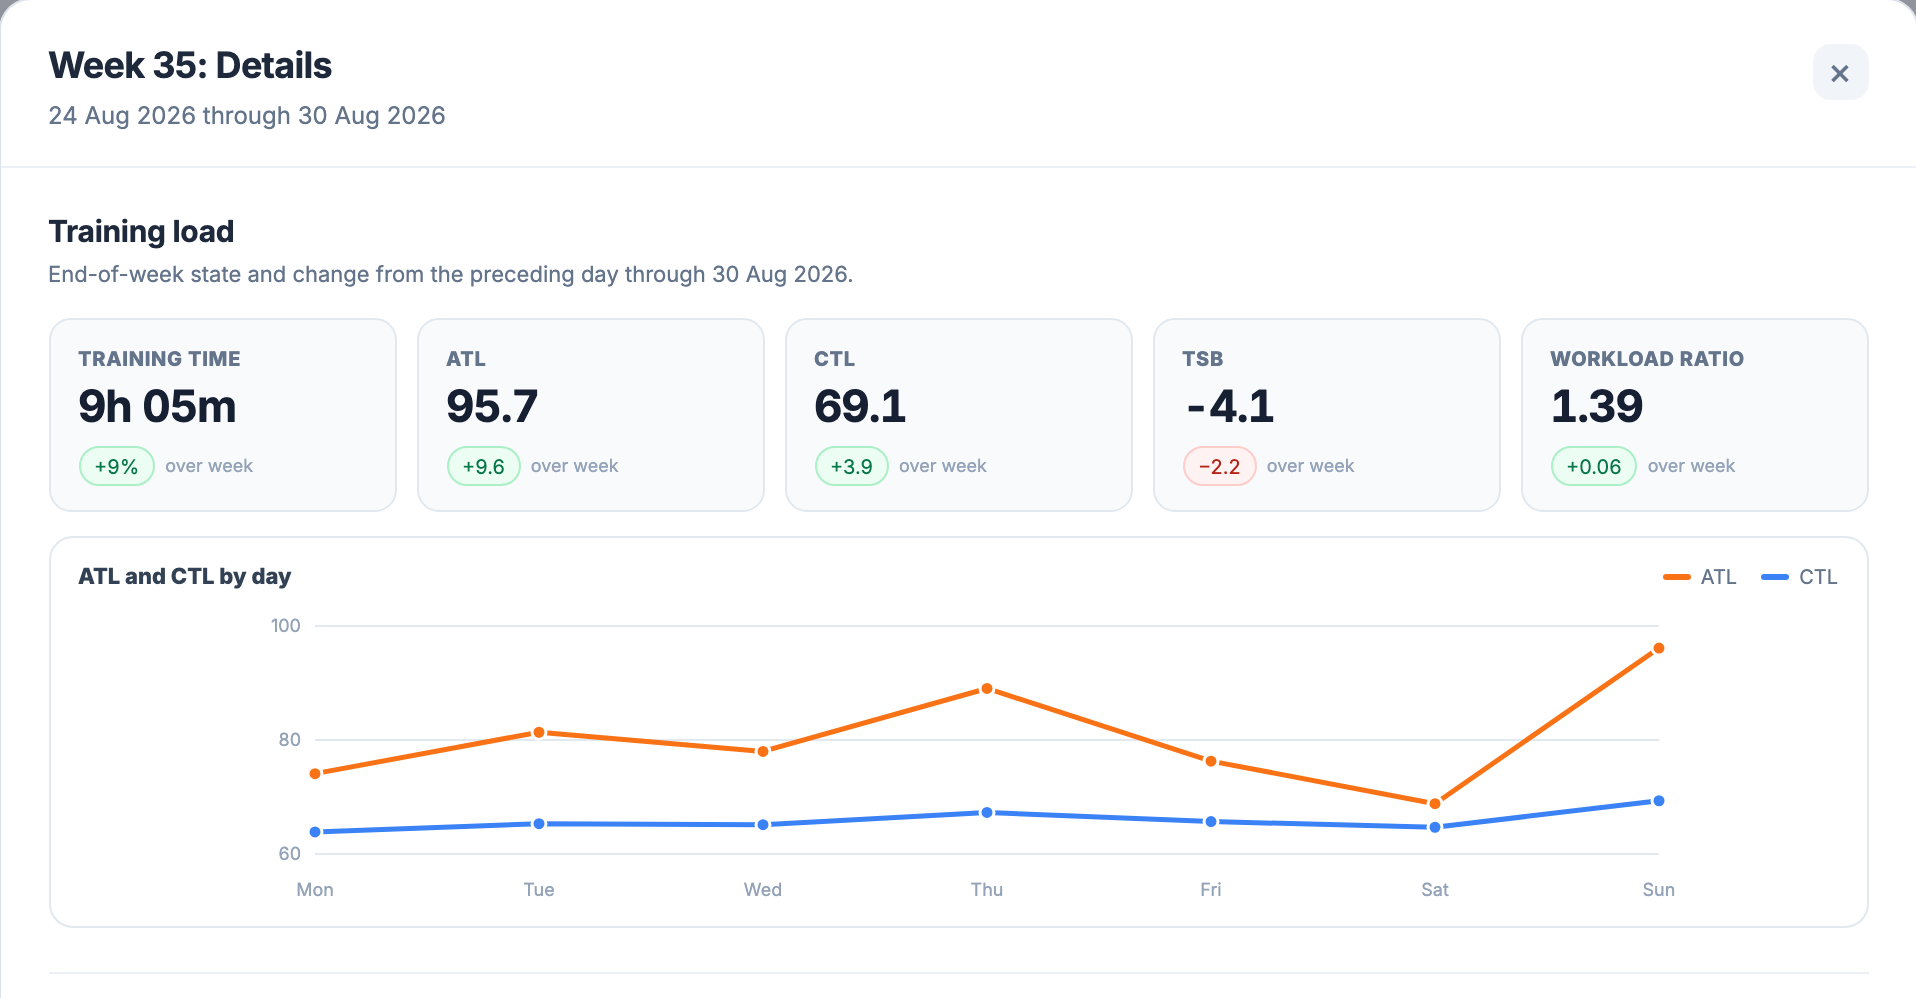
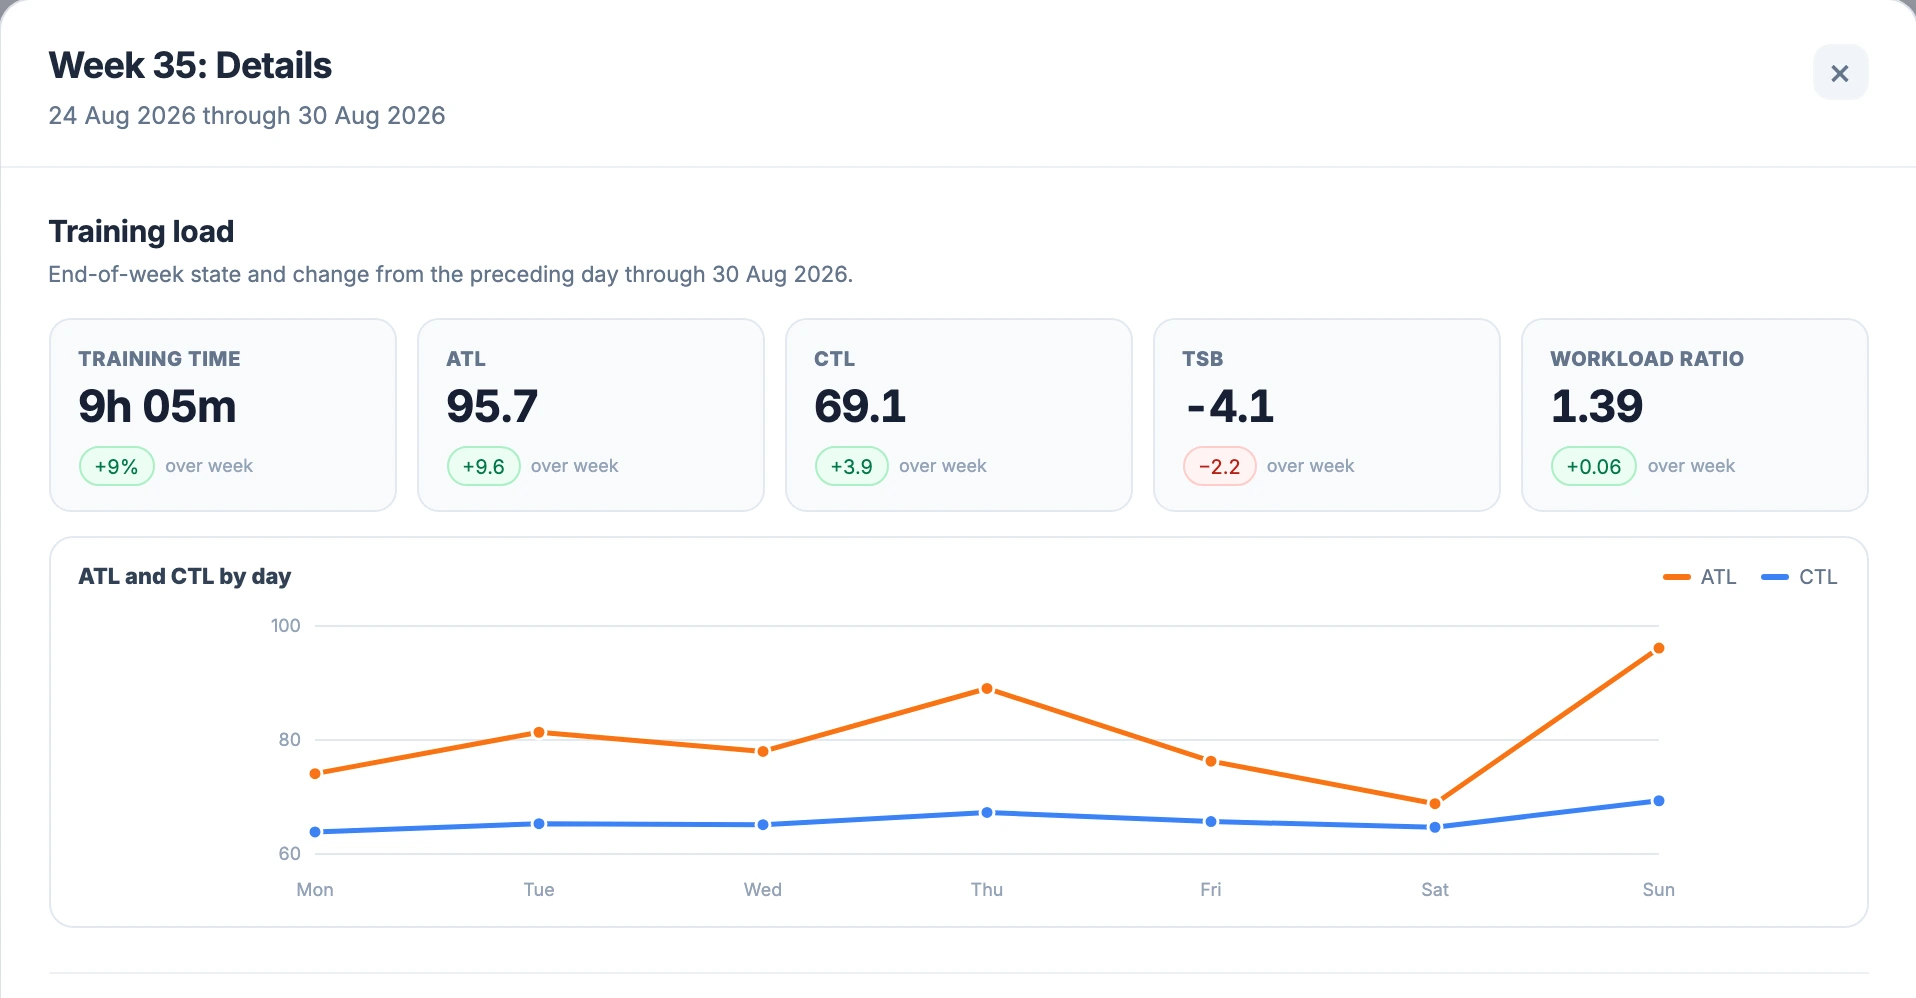
The first section of **Week 35: Details** is **Training load**. It contains **Training time**, **ATL**, **CTL**, **TSB** and **Workload ratio**, followed by **ATL and CTL by day**. The small chart draws the two load estimates across Monday–Sunday; TSB and the ratio remain in their numeric cards. Desktop chart points expose their date and value through a native hover label.
[](/marketing/product/catalog-acwr-week-desktop.png)
The +0.06 change is 1.3853 minus 1.3208 from 23 August, the day before this week. It is an absolute ratio change, not a 6% increase.Enlarge weekly workload details
For load metrics, **over week** compares the latest available day inside the week with the day immediately before the week began. A completed week normally ends on its last day; a current week uses the latest persisted day available so far. Read the **through** date. **No prior-day baseline** means the change cannot be calculated; an absent value remains a dash.
Green change badges mean the number increased, red means it decreased. An increasing workload ratio is not automatically beneficial. The training-time percentage has another comparison: the preceding week's duration. Farther down, PSS by power zone, HR intensity and sport totals help explain the sessions. Those totals can reflect the visible activity selection, while ATL and CTL come from the athlete's accumulated daily-load history.
What the ratio helps you investigate
After a concentrated training block, inspect whether ATL has risen faster than CTL and locate the days responsible. The screenshot's Sunday rise follows a 3h 45m ride. A ratio of 1.39 tells you the relative size of the current estimates; Calendar tells you how the work was distributed.
During a lighter week, watch how the relationship changes. In the following demo week, the ratio falls to **1.06** and ATL to **69.3**. CTL also falls, from **69.1 to 65.6**. The model records less recent load; deciding whether that week achieved its purpose also requires the session results and how the athlete felt. [TSB](/features/tsb/) follows the balance between these same estimates with a different date convention. [Ramp Rate](/features/ramp-rate/) measures how much CTL itself changed over seven days.
After time away or a new import, inspect the denominator before reacting to a large ratio. A small CTL makes ordinary sessions look large relative to the available baseline. Compare the current block with your own history, and use [check-ins](/features/check-ins-notes/) and recorded performance to supply context the load model cannot measure.
History, missing HR and Readiness
The model starts at the earliest recorded activity with ATL and CTL at zero. The **first 41 days** carry low-confidence context. With no positive CTL, the ratio is unavailable; 0 / 0 is not treated as 1.00. Changing the displayed chart range does not restart the model.
Rest days contribute zero TRIMP. Missing usable HR can leave an activity's contribution incomplete, and a session that was never imported can look like a rest day. Multiple sessions on one local day are summed; an activity crossing midnight belongs to its local start day. Imported history, corrected inputs or a timezone change can alter later values. See [the daily-load calculation](/learn/training-load/) for the complete preparation rules.
**Readiness workload uses a separate ratio.** It compares seven complete days ending yesterday with the average totals of the five preceding, non-overlapping weeks. Its power/HR load selection also differs. A Dashboard ACWR of 1.39 should not be substituted into the Readiness score. The [Readiness workload method](/learn/readiness/#workload) documents that calculation.
Methodology and sources
The UI, recurrence, bands and weekly comparisons were checked against current EffortSignal code on September 14, 2026. The screenshots share one synthetic athlete's persisted activity metrics and the normal daily-load calculation. ACWR research supplies context for interpretation; it does not validate the app's particular labels or thresholds.
All Pro features are free through January 31, 2027. No credit card or automatic charges. After Early Access, keep using Free or choose Pro. [See Free and Pro plans](/pricing/).